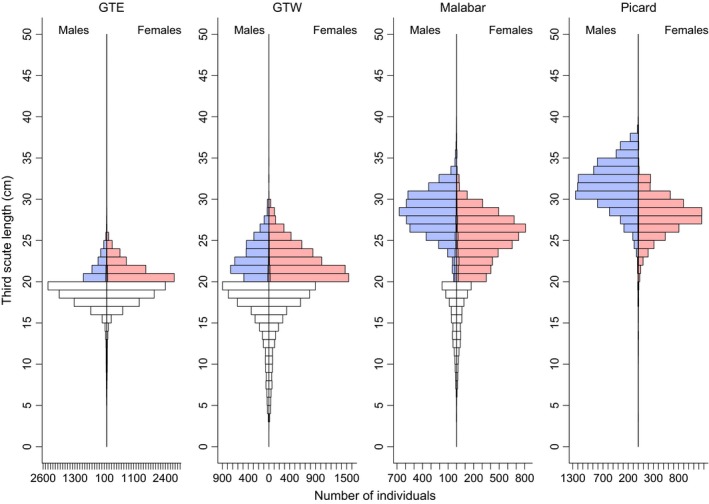
Figure 4.

Histograms of third‐scute measurements of males and females in each of the four subpopulations (GTE = Grand Terre East; GTW = Grand Terre West). Unshaded bars indicate animals of unknown sex, which have been equally assigned to males and females.
