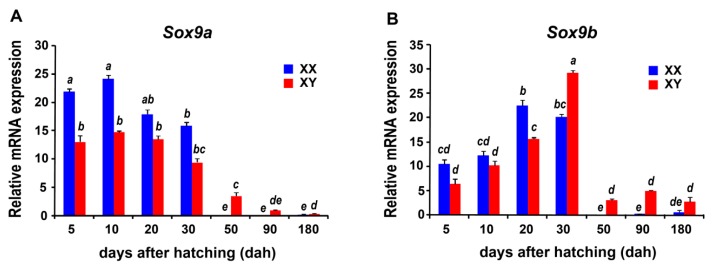
Figure 7.
Quantitative RT-PCR examination of the Sox9a (A) and Sox9b (B) expressions in the XX and XY gonads of the tilapia. The quantitative RT-PCR experiment was performed in triplicates using pooled monosex fish cDNAs in each of the selected developmental stages. Values represent the relative mRNA expression in relation to the internal control (β-actin gene). Data were expressed as the mean ± SD of the triplicates. Column error bars with the same letter are not significantly different at p < 0.05 as determined using Least Significant Difference (LSD) test.

