Figure 2.
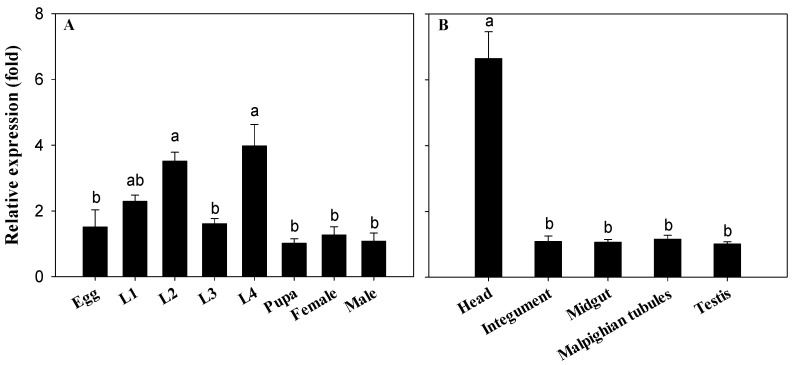
Expression profiles of CYP340W1 in different developmental stages (A) and tissues of the fourth instars (B) of ABM-S. L1 to L4: the first- to fourth- instar larva. Expression in pupa (A) and midgut (B) was set to 1. Values are means ± SEs for three independent replicates. In each panel, means with different letters are significantly different (p < 0.05; Tukey’s test).

