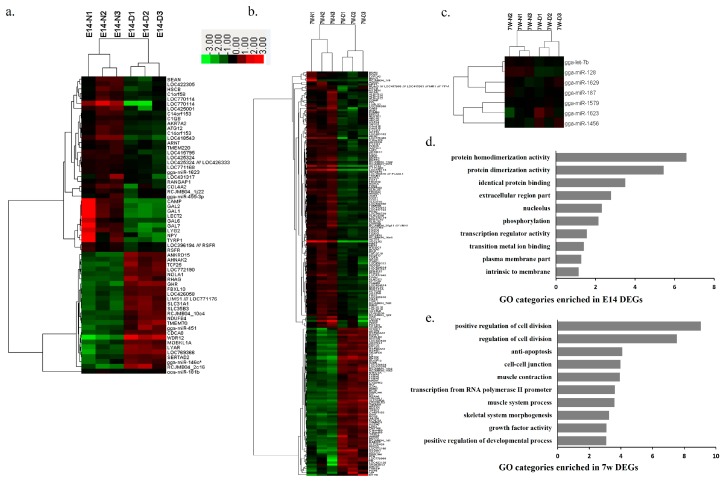
Figure 2.
Differentially expressed genes and miRNAs between SLD and normal chickens. (a) Hierarchical clustering of 55 DEGs and five DEMs between normal and SLD chickens at E14; (b) Hierarchical clustering of 173 DEGs between normal and SLD chickens at 7w; (c) Hierarchical clustering of seven DEMs between normal and SLD chickens at 7w; (d) GO enrichment for the E14 DEGs. The y axis represents GO terms and the x axis represents fold enrichment (with p value < 0.05); (e) GO enrichment for the 7w DEGs. The y axis represents GO terms and the x axis represents fold enrichment (with p value < 0.05).

