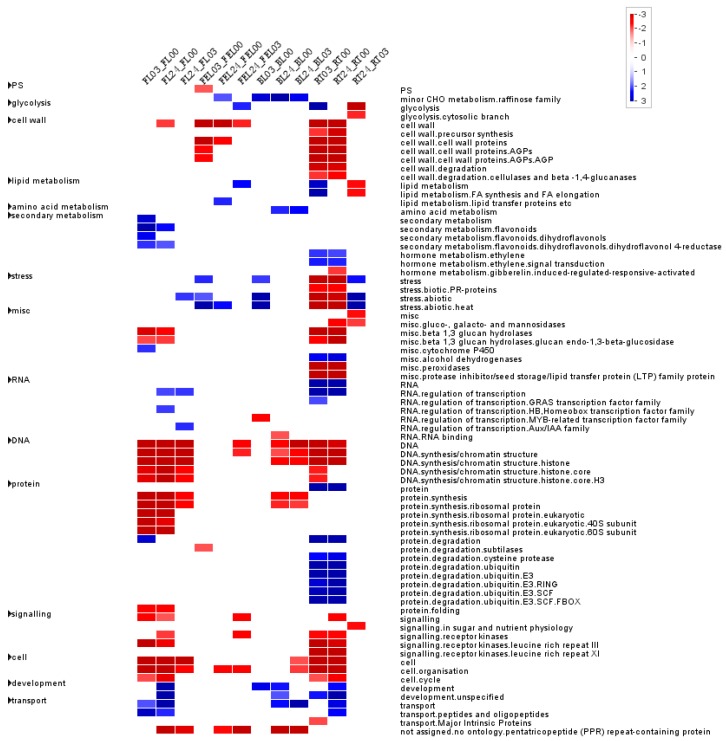
Figure 3.
Functional category enrichment of DEGs by pair-wise comparison. Each column represents the DE genes that are dramatically up (blue) or down (red) regulated when comparing two samples indicated at the top, while each row represents a functional category derived from the MapMan software. Enriched functional categories were identified based on Wilcoxon test that embedded in PageMan where ORA cutoff value was set to 1 and p-values were Benjamini-Hochberg corrected.

