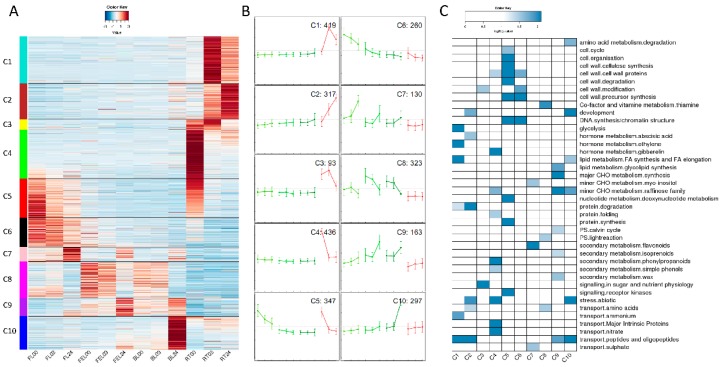
Figure 4.
Gene expression patterns across leaf and root samples. (A) Heatmap of 2785 DEGs that were grouped into ten clusters by K-mean method; (B) Expression patterns of ten clusters in (A). The samples (from left to right) are the same as those presented in (A). Error bars represent standard deviation, and DEG numbers are shown in the upper right corner; (C) Functional category enrichment of each cluster in (A).

