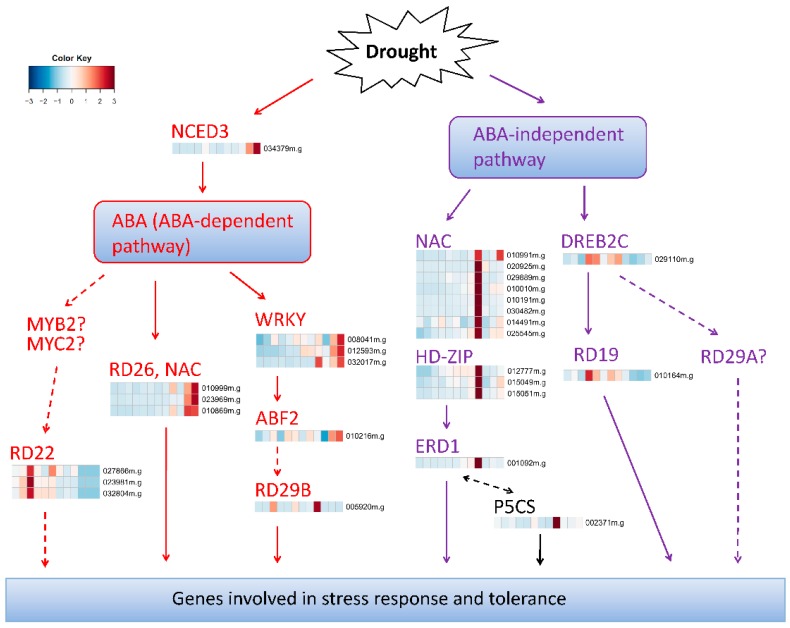
Figure 6.
A model of transcriptional regulatory networks in response to drought stress in cassava. This figure is modified from Figure 2 in ShinozakiandYamaguchi–Shinozaki ShinozakiandYamaguchi–Shinozaki [46]. ABA-dependent and ABA-independent pathways were marked with red and purple, respectively. DE genes were mapped to the regulatory networks based on Mapman annotation and/or gene co-expression patterns. Solid lines indicate the interactions that were consistent with previous reported studies, while dash lines represent the interactions reported in other plants but not confirmed in our study. Question marks indicate the genes that were not differentially expressed and their functions need to be further validated in cassava. The samples (from left to right) indicated by cells in heatmaps were the same as those in Figure 4A.

