Figure 1.
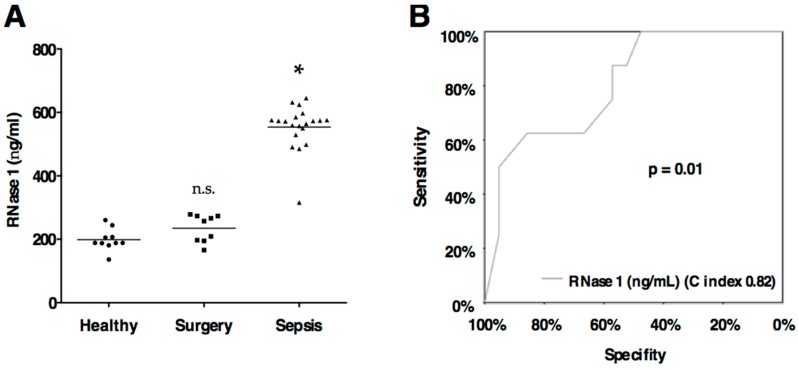
(A) RNase 1 serum levels. Serum levels of ribonuclease 1 (RNase 1) are displayed according to the groups. Black line indicates the mean. Groups: Healthy subjects (n = 10), surgical ICU patients (Surgery, n = 9) and surgical ICU patients with sepsis (n = 20) according to the definition published by the Surviving Sepsis Campaign [40]. * p < 0.05 vs. Healthy; n.s., non significant vs. Healthy; (B) RNase 1 predicts development of more than two organ dysfunctions according to the definition published by the Surviving Sepsis Campaign [40]. Logistic regression was used to evaluate serum levels of RNase 1 for the prediction of the development of more than two organ dysfunctions, and receiver operating characteristic (ROC) curves were constructed for illustration.

