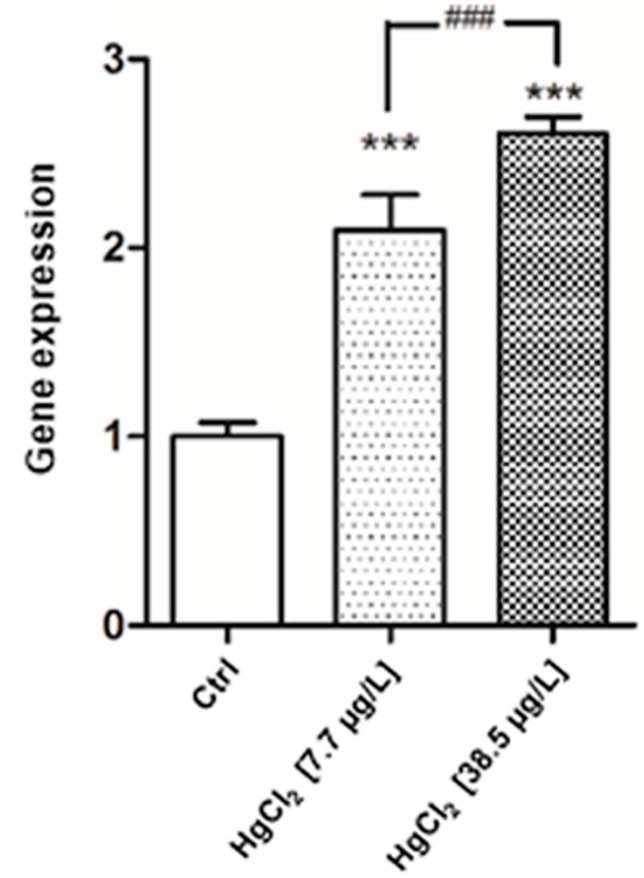
Figure 9.
Relative variations in mt Gene Expression As Compared to control in Danio rerio liver after 96 h of exposure to HgCl2 (7.7–38.5 μg/L). Taqman real time relative quantitative PCR. The bars show mean ± S.D, n = 5. Asterisks indicate the treated groups that differ from the control, *** p < 0.001; hashtags indicate difference between treated groups ### p < 0.001 (One way ANOVA followed by Bonferroni’s post hoc test).

