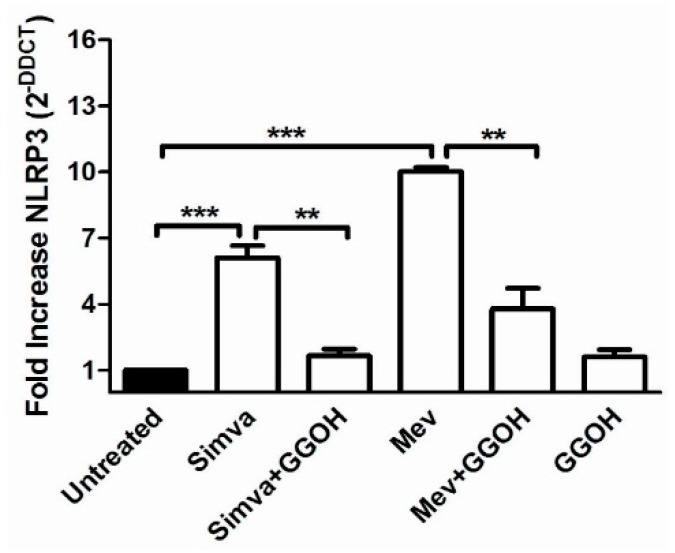
Figure 5.
NLRP3 gene expression levels of Daoy cells after different drug treatments were calculated with respect to the untreated condition using the ΔΔCt method. All data represent the results of three independent experiments and are expressed as the mean of 2 −ΔΔCt ± standard error (SE). β-Actin was used for the normalization of all Ct values. Data analyses were performed with one-way ANOVA and Bonferroni post-test; ** p < 0.01, *** p < 0.001 versus untreated.

