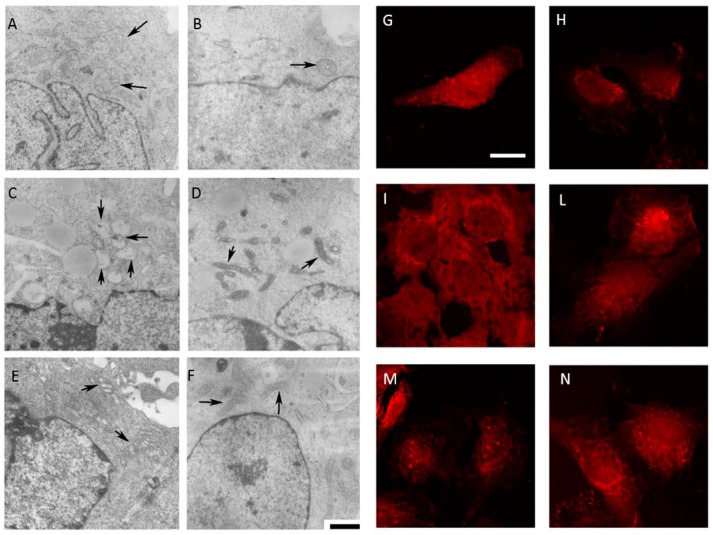
Figure 6.
(1) Representative electron micrographs of Daoy cells incubated for 48 h in complete medium with Simvastatin (10 μM) and Mevalonate (10 mM) in the presence or absence of GGOH (50 μM) for 24 h. For each picture, an enlargement of the image is displayed, showing the presence of normal or damaged mitochondria (indicated by arrowheads). Scale bar, 1 μm; (2) Confocal microscopy of Daoy cells after different treatments stained with Mito-ID (red fluorescence). Many fields were examined and over 95% of the cells displayed the patterns of the respective representative cells shown here. Scale bar, 20 μm. (A,G) untreated condition; (B,H): GGOH treatment; (C,I): Simvastatin treatment; (D,L) Simvastatin + GGOH treatment; (E,M): Mevalonate treatment; (F,N): Mevalonate + GGOH treatment.

