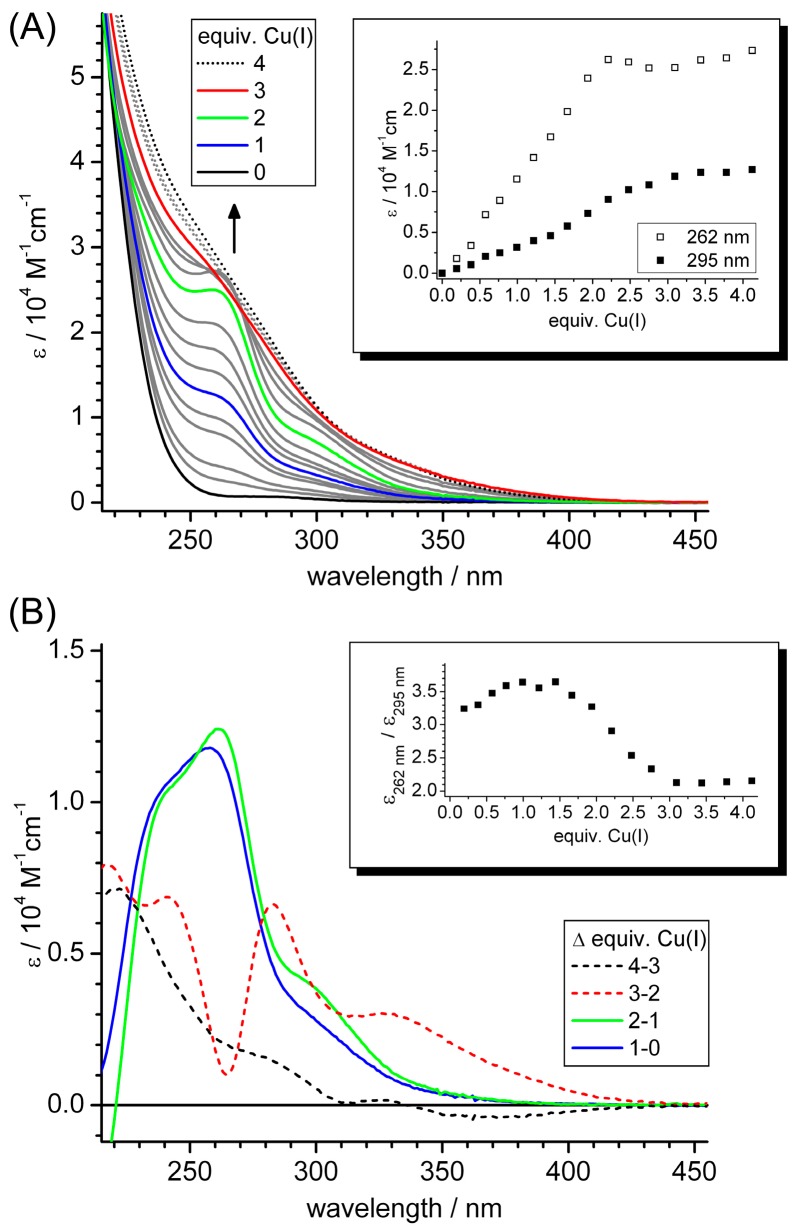
Figure 2.
Analysis of the titration of Zn2γ-Ec-1 with Cu(I) ions using UV–VIS spectroscopy. (A) Set of recorded. Dotted spectra indicate the point of constant spectral features. Inset: development of LMCT bands (262 nm) and cluster-centered transitions (295 nm); and (B) difference spectra (see text) of the titration revealing the spectral changes upon Cu(I) addition. Inset: absorptivity ratio ε262 nm/ε295 nm to visualize the changing contribution of LMCT bands versus cluster-centered transitions.

