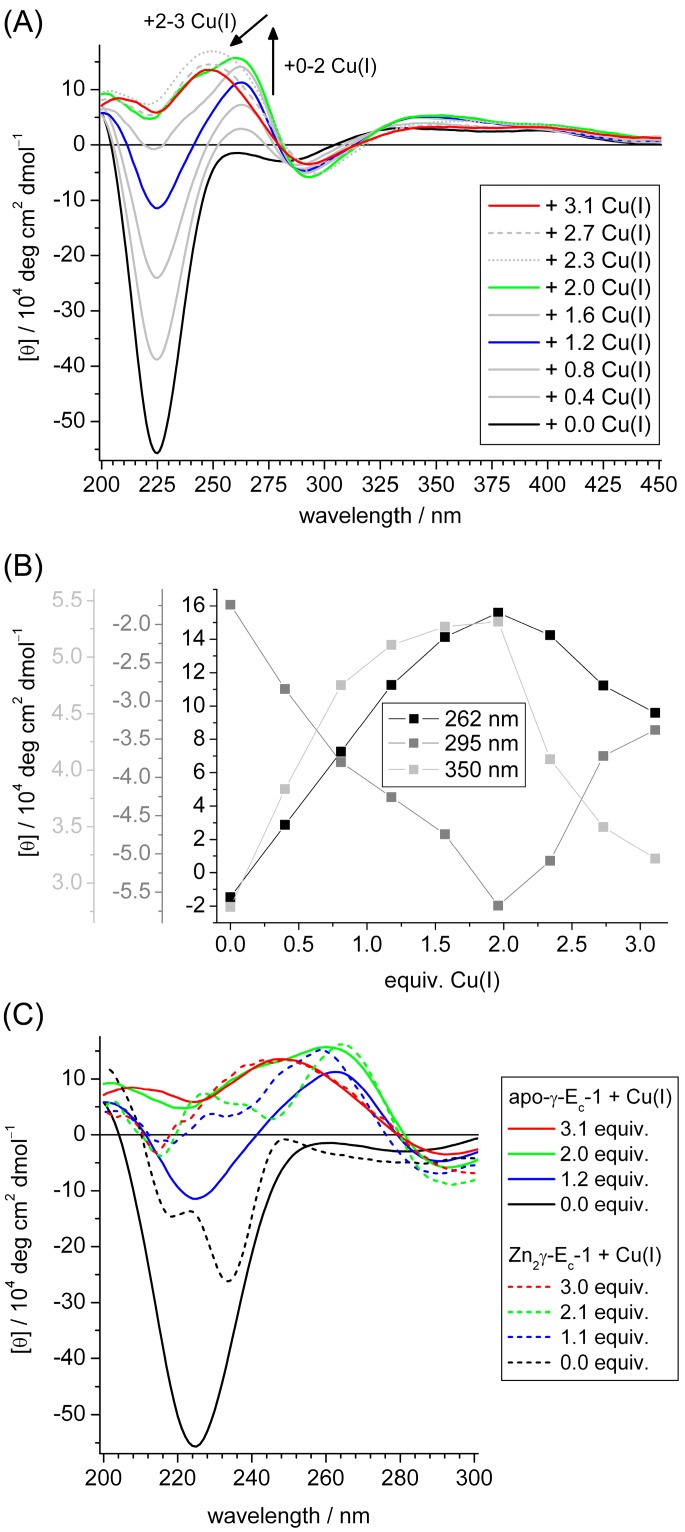
Figure 3.
Titration of apo-γ-Ec-1 with Cu(I) ions followed by CD spectroscopy. (A) Evolution of CD spectra; (B) course of ellipticity values at or close to the wavelength of the maxima observed in the CD spectra; and (C) comparison of selected spectra from (A) with the respective spectra obtained during the titration of Zn2γ-Ec-1 with Cu(I) ions (see Figure S7).

