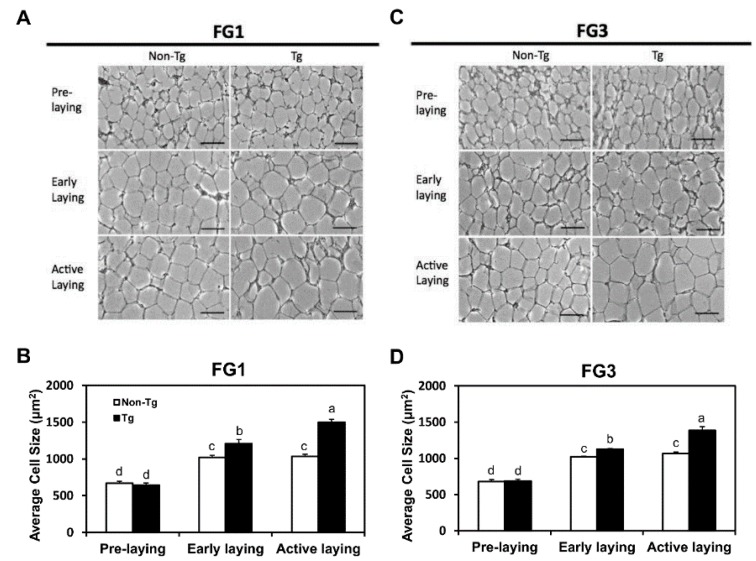
Figure 2.
Adipocyte size continually increases G0S2 transgenic quail, but stays constant in non-transgenic quail during laying. Histological images of adipocytes at different stages of egg laying for (A) line FG1 and (C) line FG3. Scale bar = 50 μm. Average cell size was calculated for (B) line FG1 and (D) line FG3 (n = 5 per group per time point). Bars represent mean ± SEM. Bars that share the same superscript letter are not significantly different from each other (p < 0.05).

