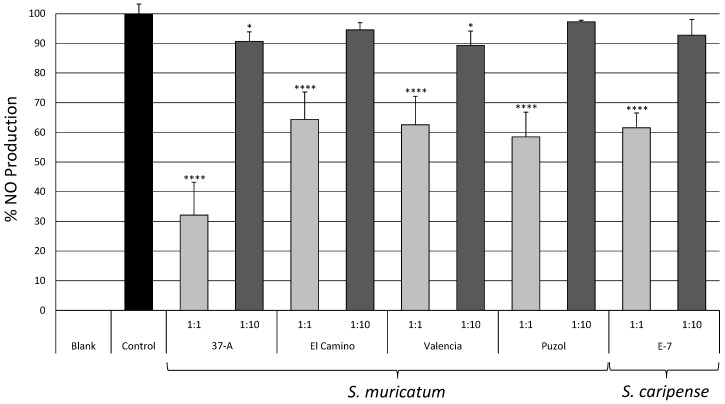
Figure 3.
Percentage of nitric oxide (NO) production of lipopolysaccharide (LPS) stimulated RAW 264.7 macrophages incubated in raw (1:1; light grey columns) and diluted (1:10; dark grey columns) methanolic extracts of pepino and S. caripense accessions compared to a control with no extract (relative production of the control is assigned a value 100%). Bars represent ± SE (n = 5) of the mean. Columns tagged with asterisks indicate that the mean values are significantly different from the control (**** and * indicate significance at p values of 0.0001 and 0.05, respectively) according to the Dunnett’s multiple comparison test.

