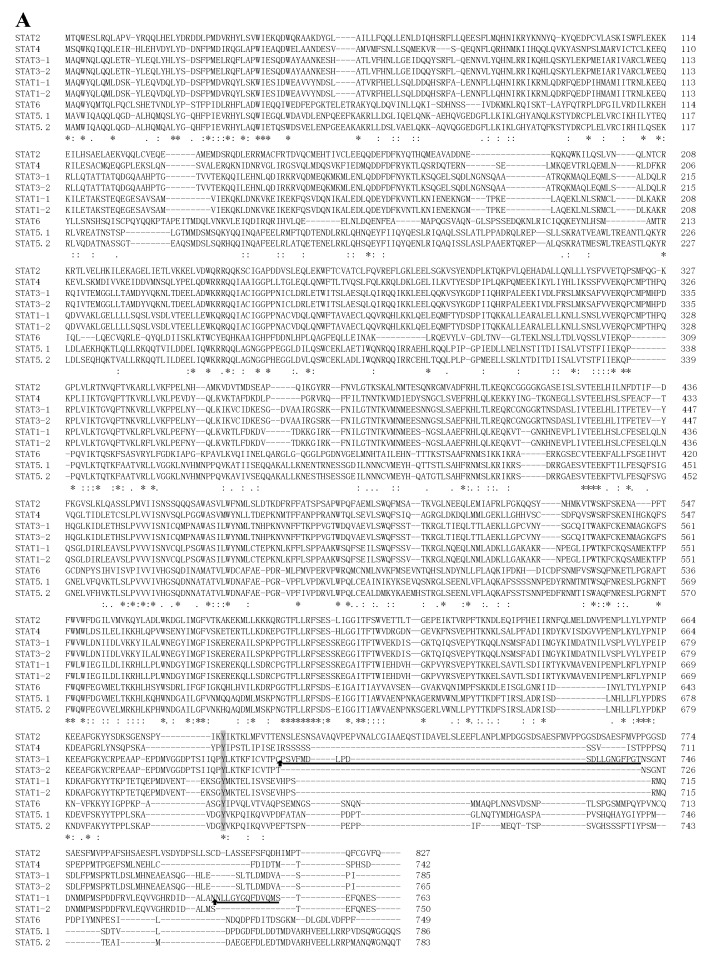
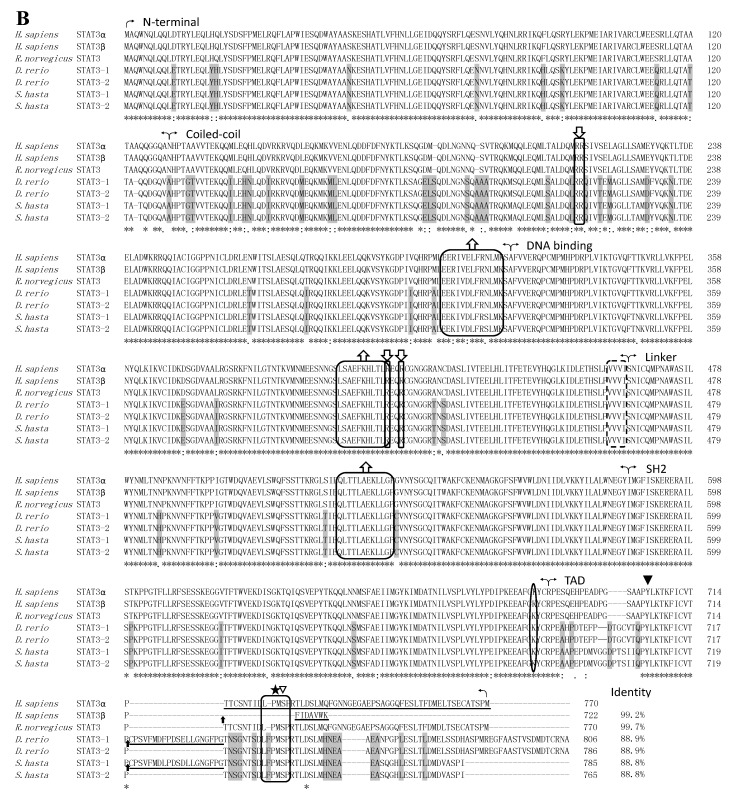
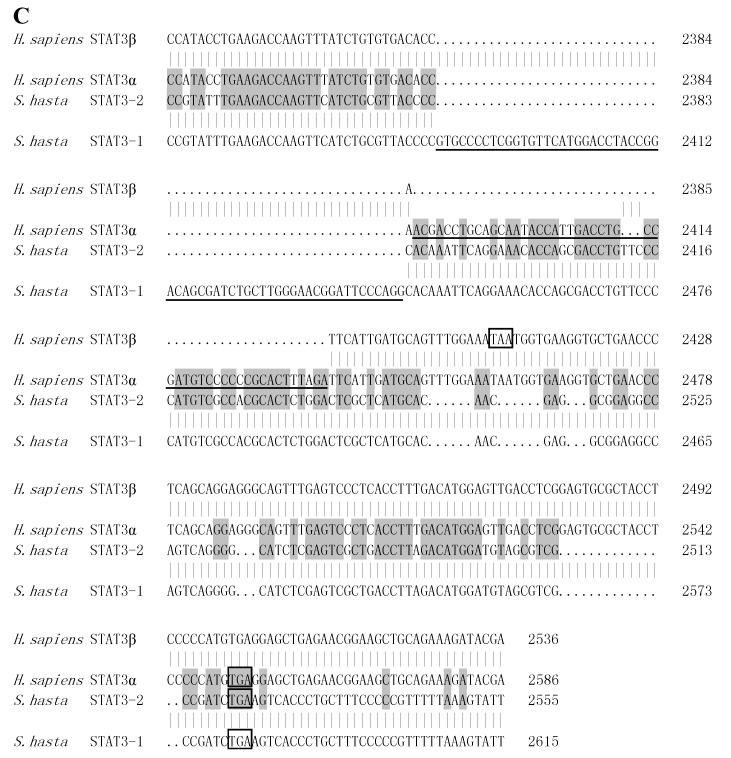
Figure 2.
Multiple sequence alignment of STATs. The accession numbers from Ensemble databases are given in Supplementary Table S1. Numbers on the right indicate the amino acid positions. Identical (*), high similar (:) and low similar (.) residues were indicated below the alignment. Hyphens represent spaces inserted to maximize similarity. (A) Alignment of the deduced amino acid sequences of STATs from S. hasta. Spliced sites are indicated by upward arrowheads. Conserved phosphorylation sites in all STAT members are shaded by a dark background. Different amino acids generated by alternative splicing are indicated by an underline; (B) Alignment of STAT3 amino acid sequences from S. hasta, D. rerio, H. sapiens and R. norvegicus. Curved arrowheads represent the boundaries of different domains. Upward arrowheads represent spliced sites. Different amino acids generated by alternative splicing are indicated by an underline. A solid triangle represents a single phosphotyrosine that is present in all activated STATs, and an open triangle represents a single phosphoserine that is present in several STATs [1]. A single lysine residue that regulates STAT3 dimerization by reversible acetylation is denoted by an oval frame. Boxes and stars represent the LPMSP motif [18]. Nuclear export signals (NES) are indicated by a box and an upward arrowhead [19]. Nuclear localization signals (NLS) are indicated by a box and a downward arrowhead. A dotted box represents the region that plays a role in nuclear translocation induced by growth hormone in STAT5B, but mutation of it has no effect in STAT3 [20]. The amino acid divergence between fish and mammals is shaded by a dark background; (C) Alignment of STAT3 nucleotides sequences from S. hasta and H. sapiens. The conserved nucleotides of STAT3 in the same species are indicated by a vertical line. The conserved nucleotides between H. sapiens STAT3α and H. hasta STAT3-2 are shaded by a dark background. The positions of the stop codons are indicated by a box. Different cDNA sequences generated by alternative splicing are indicated by an underline.


