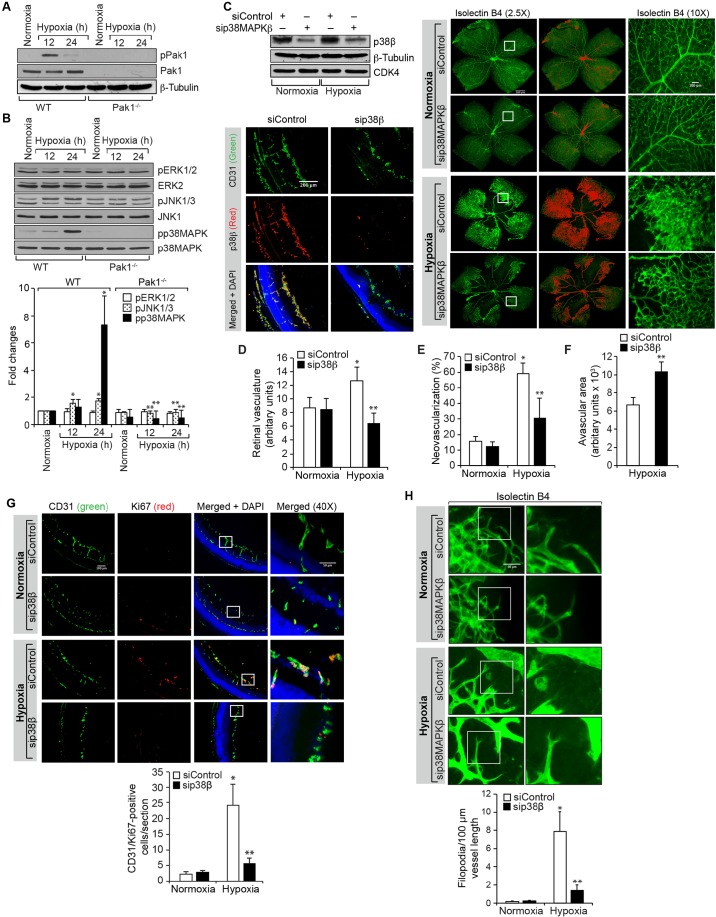
Fig. 3.
p38MAPKβ mediates hypoxia-induced retinal neovascularization. (A,B) Eyes from WT and Pak1−/− mice pups left in normoxia or at various time periods of hypoxia were enucleated, retinas were isolated and extracts were prepared. An equal amount of protein from each condition was analyzed by western blotting for the indicated phosphoproteins using their phosphospecific antibodies and normalized to their total levels. p, phosphorylated form of the protein. (C) WT mice pups after exposure to 75% oxygen from P7 to P12 were injected intravitreally with control siRNA (siControl) or p38MAPKβ siRNA (sip38MAPKβ) at P12, P13 and P15. At P15 the retinas were isolated and tissue extracts were prepared and analyzed by western blotting for p38MAPKβ (p38β), β-tubulin and CDK4 levels to show the efficacy of the siRNA on its target and off target molecules. Alternatively, retinas were fixed, and cut sections were stained for CD31 and p38MAPKβ to show the effect of the siRNA on its target molecule level in endothelial cells, or at P17 the retinas were isolated, stained with isolectin B4, and flat mounts were prepared and examined for retinal neovascularization. Retinal vascularization is shown in the first column. Neovascularization is highlighted in red in the second column. The third column shows the selected rectangular areas of the images in the first column under 10× magnification. Scale bars: 500 μm (right panel, left two columns), 200 μm (right panel, right column). (D–F) Retinal vasculature (D), neovascularization (E) and avascular area (F) were determined as described in the Materials and Methods. (G) All the conditions were the same as in C except that mice pups were injected intravitreally with control or p38MAPKβ siRNA at P12 and P13 and at P15, the retinas were isolated, fixed, and cross-sections were made and stained for immunofluorescence analysis of CD31 and Ki67. The right column shows the areas selected by the rectangular boxes in the left column images as viewed under higher magnification (40×). (H) All the conditions were the same as in G except that at P15 the retinas were isolated, stained with isolectin B4, and flat mounts were made and examined for filopodia under the fluorescent microscope at 40× magnification. The bar graphs represent quantitative analysis of three independent experiments or six retinas. The values represent mean±s.d. *P<0.01 vs WT normoxia; **P<0.01 vs WT hypoxia (one-way ANOVA followed by Tukey's post-hoc test).

