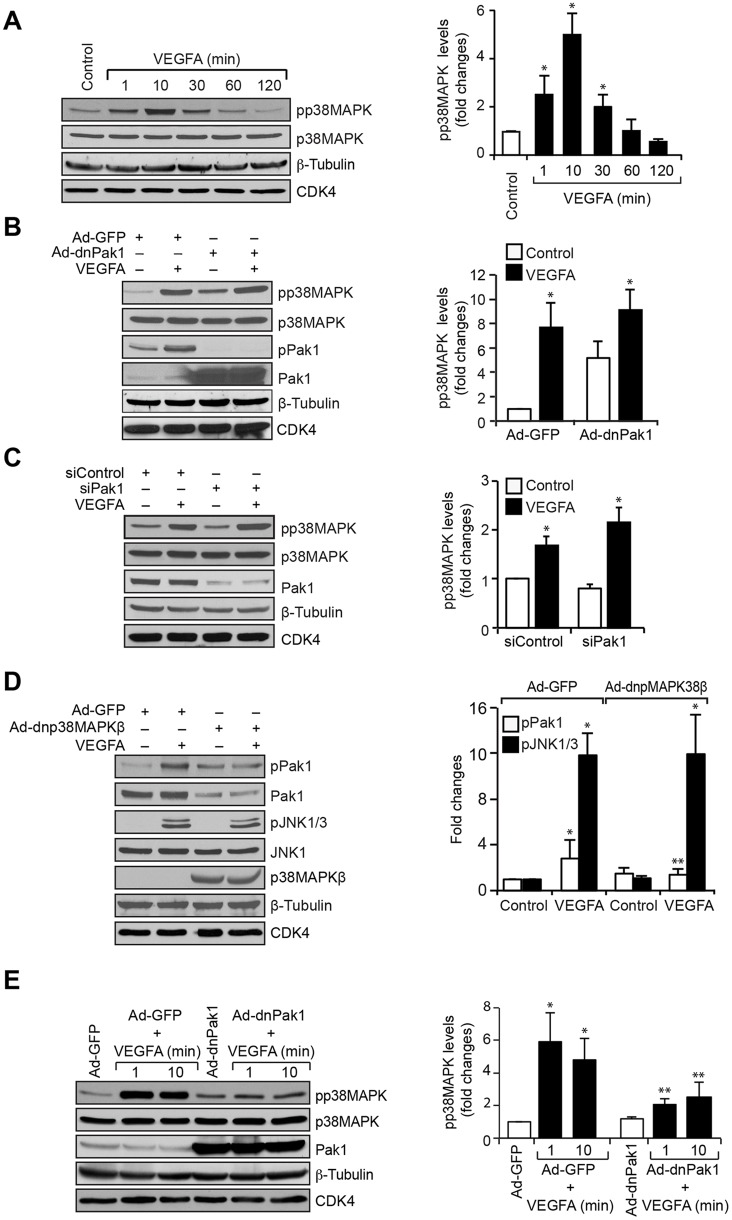
Fig. 4.
p38MAPKβ mediates Pak1 activation. (A) Quiescent HRMVECs were treated with and without VEGFA (40 ng/ml) for the indicated time periods and cell extracts were prepared. Equal amounts of protein from control and each treatment were analyzed by western blotting for phosphorylated (p)p38MAPK using its phosphospecific antibodies and normalized to its total levels, as well as to β-tubulin and CDK4 levels. (B) Cells were transduced with Ad-GFP or Ad-dnPak1 at 40 MOI, growth-arrested, and treated with and without VEGFA (40 ng/ml) for 10 min. Then, cell extracts were prepared and analyzed by western blotting for pp38MAPK and phosphorylated (p)Pak1 levels using their phosphospecific antibodies and reprobed for p38MAPK, Pak1, β-tubulin or CDK4 levels for normalization or to show the overexpression of dnPak1. (C) HRMVECs were transfected with control or Pak1 siRNA (100 nM), growth-arrested, treated with and without VEGFA (40 ng/ml) for 10 min. Then, cell extracts were prepared and an equal amount of protein from control and each treatment was analyzed by western blotting for pp38MAPK levels using its phosphospecific antibodies and reprobed for p38MAPK, Pak1, β-tubulin or CDK4 levels to show the efficacy of the siRNA on its target and off target molecules. (D) Cells were transduced with Ad-GFP or Ad-dnp38MAPKβ at 40 MOI, growth-arrested, treated with and without VEGFA (40 ng/ml) for 10 min. Then, cell extracts were prepared and analyzed by western blotting for pPak1 and phosphorylated (p)JNK1 and JNK3 levels using their phosphospecific antibodies and reprobed for Pak1, JNK1, p38MAPKβ, β-tubulin or CDK4 levels for normalization or to show the overexpression of dominant negative p38MAPKβ. (E) Mouse retinal microvascular endothelial cells were transduced with Ad-GFP or Ad-dnPak1 at 40 MOI, growth-arrested, treated with and without mouse VEGFA (40 ng/ml) for 1 and 10 min. Then, cell extracts were prepared and analyzed by western blotting for pp38MAPK levels using its phosphospecific antibodies, and reprobed for p38MAPK, Pak1, β-tubulin or CDK4 levels for normalization or to show the overexpression of dnPak1. The bar graphs represent quantitative analysis of three independent experiments. The values represent mean±s.d. *P<0.01 vs control, Ad-GFP or siControl; **P<0.01 vs VEGFA, Ad-GFP+VEGFA or siControl+VEGFA (one-way ANOVA followed by Tukey's post-hoc test).

