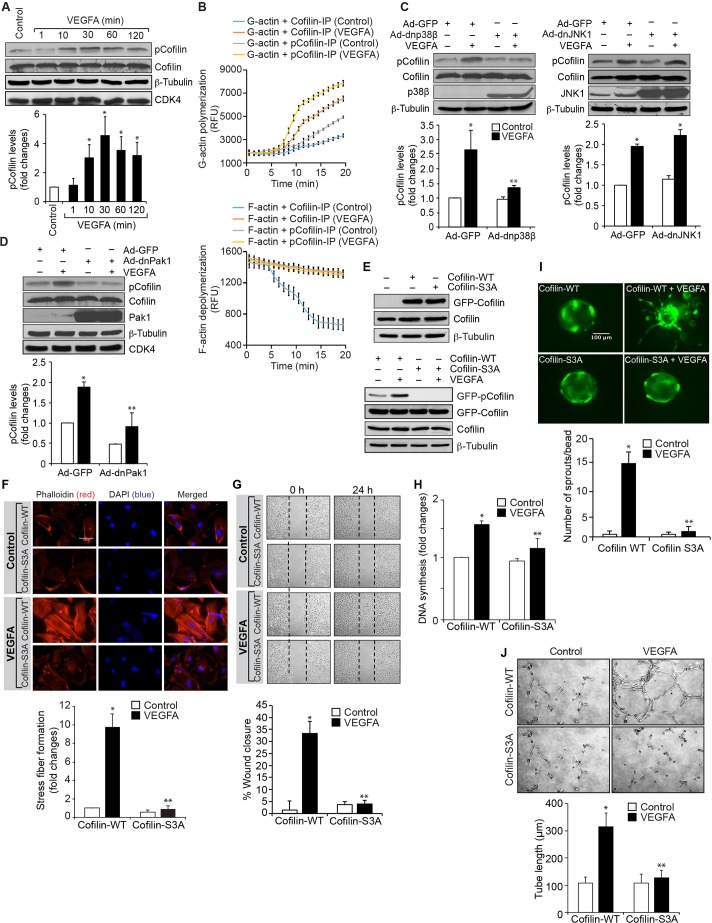
Fig. 6.
Cofilin regulates VEGFA-induced angiogenic events in HRMVECs. (A) Quiescent HRMVECs were treated with and without VEGFA (40 ng/ml) for the indicated time periods and cell extracts were prepared. Equal amounts of protein from control and each treatment were analyzed by western blotting for phosphorylated (p)cofilin levels using its phosphospecific antibody. (B) Antibody-immunoprecipitated (IP) cofilin and phosphorylated cofilin immunocomplexes of control and 30 min of VEGFA (40 ng/ml)-treated cells were subjected to an assay to measure their actin polymerization and severing activities as described in the Materials and Methods. (C,D) HRMVECs were transduced with Ad-GFP, Ad-dnp38MAPKβ, Ad-dnJNK1 or Ad-dnPak1 at 40 MOI, growth-arrested, treated with and without VEGFA (40 ng/ml) for 30 min. Then, cell extracts were prepared and analyzed by western blotting for phosphorylated cofilin levels as described in panel A. The blots in panels A,C and D were reprobed for cofilin, p38MAPKβ, JNK1, Pak1, β-tubulin or CDK4 for normalization or to show the overexpression of the indicated dominant-negative mutants. (E) Upper panel, HRMVECs were transfected with GFP-tagged cofilin WT or cofilin S3A mutant plasmid and, 36 h later, cell extracts were prepared and analyzed by western blotting for cofilin levels to show the overexpression of WT and phosphomutant cofilin. Lower panel, after transfection, cells were growth-arrested, treated with and without VEGFA (40 ng/ml) for 30 min and cell extracts were prepared and analyzed by western blotting for phosphorylated and normal coflin levels and the blots were normalized to β-tubulin. (F–J) All the conditions were the same as in bottom panel of E except that after quiescent cells were subjected to VEGFA (40 ng/ml)-induced F-actin stress fiber formation (F, scale bars: 50 μm), migration (G), DNA synthesis (H), sprouting (I) or tube formation (J) assays. The bar graphs represent a quantitative analysis of three independent experiments. The values represent mean±s.d. *P<0.01 vs Ad-GFP or cofilin WT; **P<0.01 vs Ad-GFP+VEGFA or cofilin WT+VEGFA (one-way ANOVA followed by Tukey's post-hoc test).

