Fig. 3.
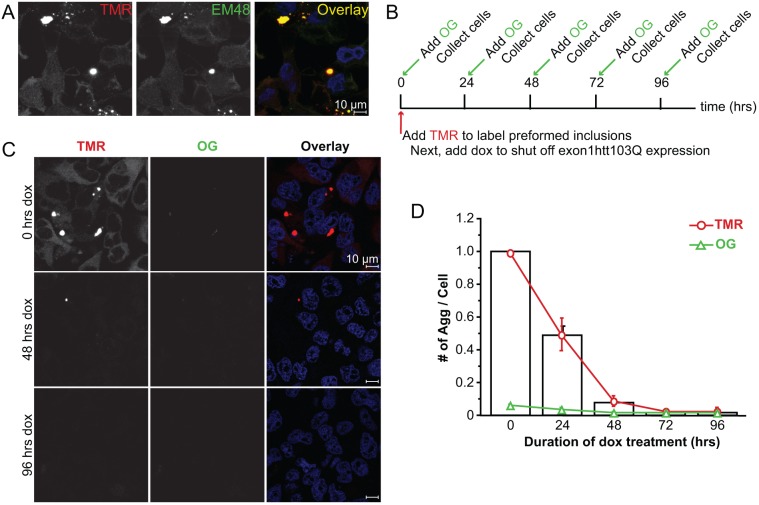
The inducible Exon1Htt103Q–HaloTag cell line demonstrates aggregate clearance upon dox administration. (A) EM48 immunofluorescence (green) confirms that the TMR-positive aggregates (red) represent aggregated exon1Htt103Q–HaloTag. Nuclei are stained with Hoechst 33342 (blue). (B) Time line outlining experimental design. Stable cell lines are maintained in the ‘on’ state. At time 0, cells are exposed to 0.5 μM TMR for 30 min, and then doxycycline (dox). Prior to analysis (0 h), and at 24, 48, 72 and 96 h later, cells are exposed to 1.5 mM Oregon Green (OG) for 30 min to label the newly formed exon1Htt103Q–HaloTag protein. (C,D) Representative images (C) and quantification (D) at time 0, 48 and 96 h after treatment with 1 μg/ml of dox. Examining the TMR (red) and Oregon Green (green) channel reveals no detectable Oregon Green staining. Quantification of all of the aggregates detected in both channels reveals that when expression is abolished, aggregates are no longer detectable after 72 h. Very little detectable Oregon-Green-positive structures are found, and the TMR-positive aggregates are primarily cleared. Data represented as mean+s.d. from n=4 independent experiments. An average of 1000 cells per time point was counted. Scale bars: 10 μm.

