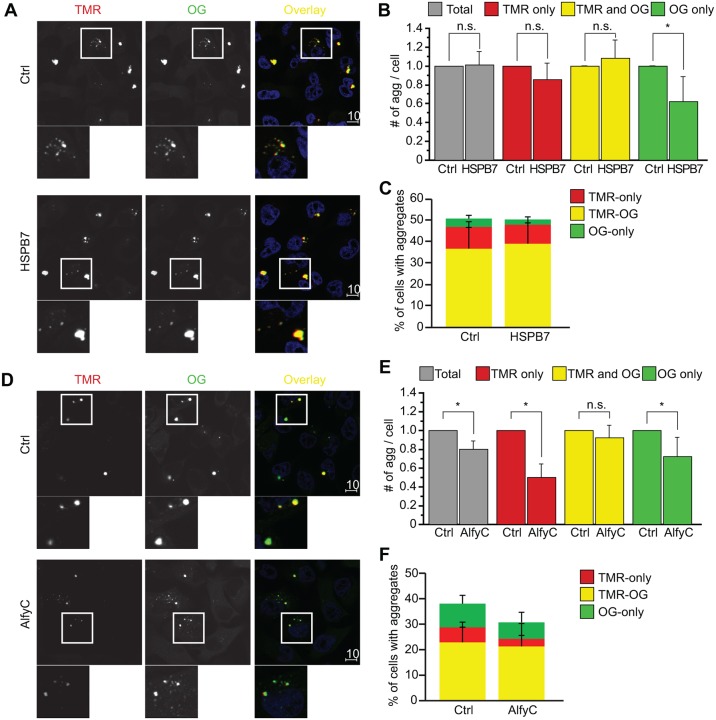
Fig. 6.
HspB7 suppresses the formation of new aggregates, whereas AlfyC stimulates the clearance of aggregates that are no longer growing. Exon1Htt103Q–HaloTag cells were transfected with HspB7 or AlfyC with their respective Ctrl (empty vector). After exchanging the transfection medium, cells were exposed to TMR (red) to label pre-existing protein. After 48 to 72 h, Oregon Green (OG) was added to label newly expressed proteins, then cells were analyzed for TMR-only, TMR and Oregon Green double-positive and Oregon-Green-only positive structures. Nuclei are stained with Hoechst 33342 (blue). (A–C) HspB7-transfected cells. (A) Representative images 48 h after Ctrl or HspB7 transfection. Areas highlighted in the white boxes are shown at higher magnification below the respective image. (B) Quantification of TMR-only, Oregon Green double-positive and Oregon-Green-only aggregates normalized to Ctrl. Similar to in Fig. 2B, HspB7 does not decrease the total number of aggregates [F(1,10)=0.024; P=0.8800], because HspB7 does not affect the number of pre-existing (TMR-only) and growing (TMR and Oregon Green) aggregates [F(1,10)=4.224; P=0.697 and F(1,10)=1,149; P=3.090, respectively]. HspB7 overexpression, however, leads to a significant decrease of Oregon-Green-only aggregates [F(1,10)=12.247; *P=0.0057], indicating that HspB7 affects the formation of new aggregates. (C) Graphical representation of how the different aggregate stages are represented in the total number. Consistent with Fig. 5, the majority of the aggregates are TMR and Oregon Green double-positive, followed by TMR-only then Oregon Green-only. Therefore, despite the impact HspB7 had on Oregon-Green-only aggregates, there was not a significant impact on the total number of aggregates present. (D–F) AlfyC-transfected cells. (D) Representative images 72 h after Ctrl or AlfyC transfection. (E) Quantification of TMR-only, TMR and Oregon Green double-positive and Oregon-Green-only aggregates normalized to Ctrl. Similar to in Fig. 2A, AlfyC decreases the total number of aggregates [F(1,10)=32.595; P=0.0002]. This decrease is due to a significant decrease in TMR-only and Oregon-Green-only aggregates [F(1,10)=71.548; P<0.0001 and F(1,10)=11.111; P=0.0076, respectively]. There was no impact on the TMR and Oregon Green double-positive growing aggregates in the presence of AlfyC [F(1,10)=2.054; P=0.1823]. (F) Graphical representation of how the different aggregate stages are represented within the total number of aggregates. Data are represented as mean+s.d. from n=6 independent experiments. An average of 750 cells per time point was counted. Scale bars: 10 μm. Two-tailed ANOVAs were performed to determine statistical significance. n.s., not statistically significant.

