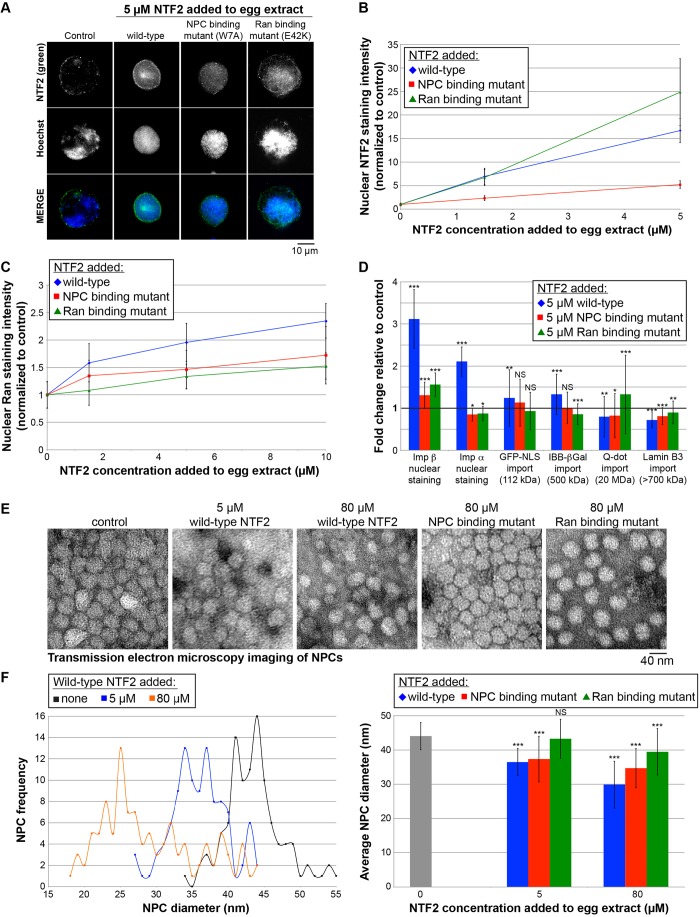
Fig. 2.
Effects of wild-type and mutant NTF2 proteins on nuclear localization of transport factors, nuclear import, and NPC diameter. (A) X. laevis egg extract was supplemented with recombinant wild-type and mutant NTF2 proteins at the indicated final concentrations, and the same total volume was added to each reaction. For the control reaction, an equal volume of NTF2 storage buffer was added. Nuclei were assembled and growth was allowed to proceed for 90 min at 20°C. Nuclei were fixed, spun onto coverslips, processed for immunofluorescence, and stained with an antibody against NTF2 (green) and Hoechst 33342 to visualize the DNA (blue). Representative images acquired with the same exposure time are shown. (B) For each data point, the nuclear NTF2 fluorescence staining intensity per unit area was quantified for 102–117 nuclei, averaged and normalized to the buffer control (set at 1.0). The error bars are s.d. All data points are statistically different from the buffer control (1.0) by at least P<0.001 (two-tailed Student's t-test). One representative experiment out of three is shown. (C) Similar experiments were performed except that nuclei were stained with an antibody against Ran. For each data point, the nuclear Ran fluorescence intensity per unit area was quantified for 100–130 nuclei, averaged and normalized to the buffer control (set at 1.0). The error bars are s.d. All data points are statistically different from the buffer control (1.0) by at least P<0.05 (two-tailed Student's t-test). One representative experiment out of six is shown. (D) Similar experiments were performed except that only the 5 µM concentration of added NTF2 protein was tested. As indicated, nuclei were either stained with an antibody against importin β or importin α2, or import of the indicated cargos was quantified as previously described (Lyman et al., 2002; Levy and Heald, 2010). For each data point, the nuclear fluorescence intensity per unit area was quantified for 111–1108 nuclei, averaged and normalized to the buffer control (bold horizontal line set at 1.0). The error bars are s.d. One representative experiment out of three is shown. *P<0.05; **P<0.01; ***P<0.001; NS, not significant (two-tailed Student's t-test). The GST–GFP-NLS cargo is listed as 112 kD assuming it is dimeric. The lamin B3 cargo is listed as >700 kDa based on gel filtration experiments (Adam et al., 2008; Gambus et al., 2011). (E) Nuclei were assembled as described in A. Unfixed nuclei were negatively stained with uranyl acetate, and NPCs were visualized by TEM. Representative images are shown. Although this approach does not provide structural details of the NPC, we prefer this method for quantifying NPC diameters because the NPCs are not fixed and their structures are minimally perturbed during sample preparation. (F) For each sample, TEM images were acquired for 6–7 different nuclei, and the diameters of 103–123 NPCs were quantified using ImageJ. As negative staining outlines the entire NPC, here we are quantifying the diameter of the NPC and not the central channel. NPC frequency refers to the number of NPCs with the indicated NPC diameter. The error bars are s.d. ***P<0.001; NS, not significant (two-tailed Student's t-test).

