Fig. 7.

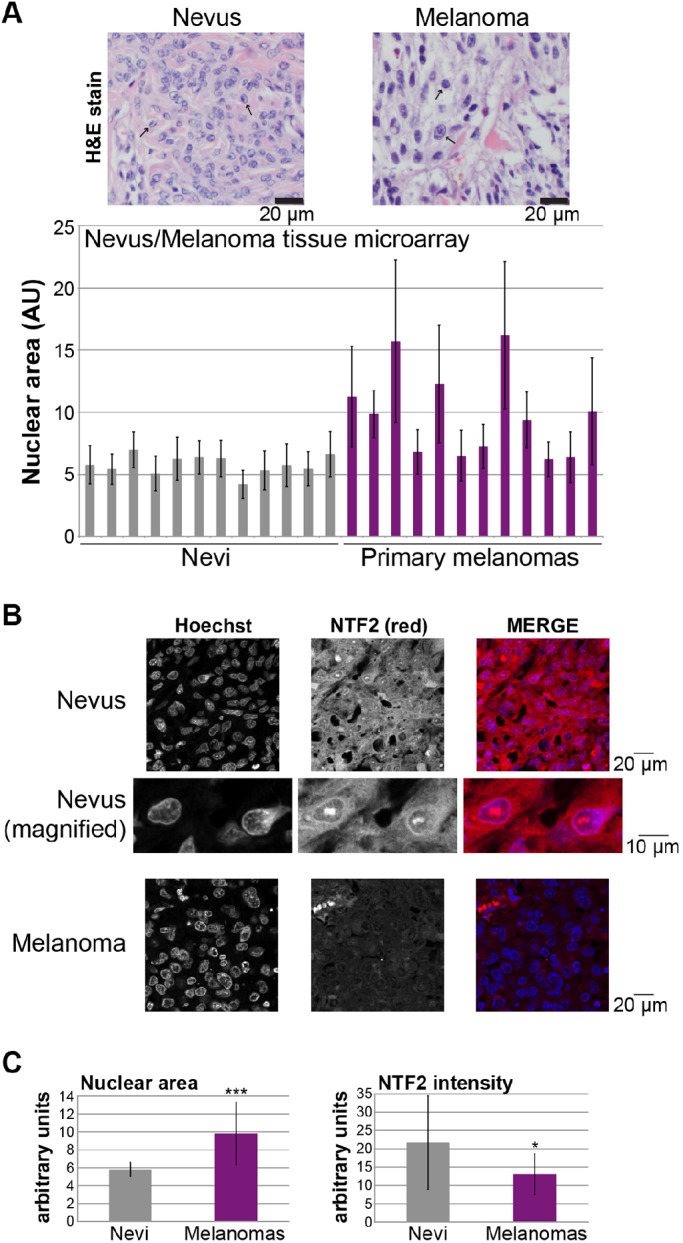
Nuclear size and NTF2 expression are inversely correlated during melanoma progression. (A) Nuclear cross-sectional areas were measured from an H&E-stained melanoma tissue microarray (ME1004c, US Biomax, Inc.). One representative image each of a nevus (i.e. benign melanocytic proliferation) and a melanoma (i.e. primary malignant melanocytic lesion) is shown, and representative blue-stained nuclei are indicated with arrows. For each tissue sample, the cross-sectional areas of 30 adjacent melanocyte nuclei within a single randomly selected field were measured and averaged. Because these are tissue sections and nuclei might not be sectioned through their widest plane, data are presented in arbitrary units (AU) to emphasize that only relative comparisons between samples can be accurately determined. Samples with extensive necrosis or pigment were avoided. Each bar in the graph represents a different tissue biopsy. Error bars are s.d. (B) An unstained ME1004c microarray was processed for immunofluorescence using an antibody against NTF2 (red), and nuclei were stained with Hoechst 33342 (blue). Images were acquired at the same exposure time. Representative images are shown from one nevus and one melanoma. The NTF2 is mostly localized to the cytoplasm and nuclear envelope rim. (C) The NTF2-stained microarray described in B was quantified. Images were acquired at the same exposure time. NTF2 staining intensity measurements were performed for more than 20 regions (each encompassing 1–3 cells) of each tissue sample, corrected for the background signal, normalized for the area of the measurement region and averaged. Brightly staining streaks and puncta suggestive of non-specific or necrotic staining were avoided. Instead, regions of viable tissue with similar cell densities were selected for quantification. Nuclear sizes and NTF2 staining intensities were measured for the same tissue samples. The left graph shows average nuclear areas for 12 nevi and 12 melanomas. The right graph shows the average NTF2 staining intensities for those same samples. Individual melanoma nuclear area measurements adopt a unimodal distribution (data not shown). Error bars are s.d. *P<0.05; ***P<0.001 (two-tailed Student's t-test).
