Fig. 2.
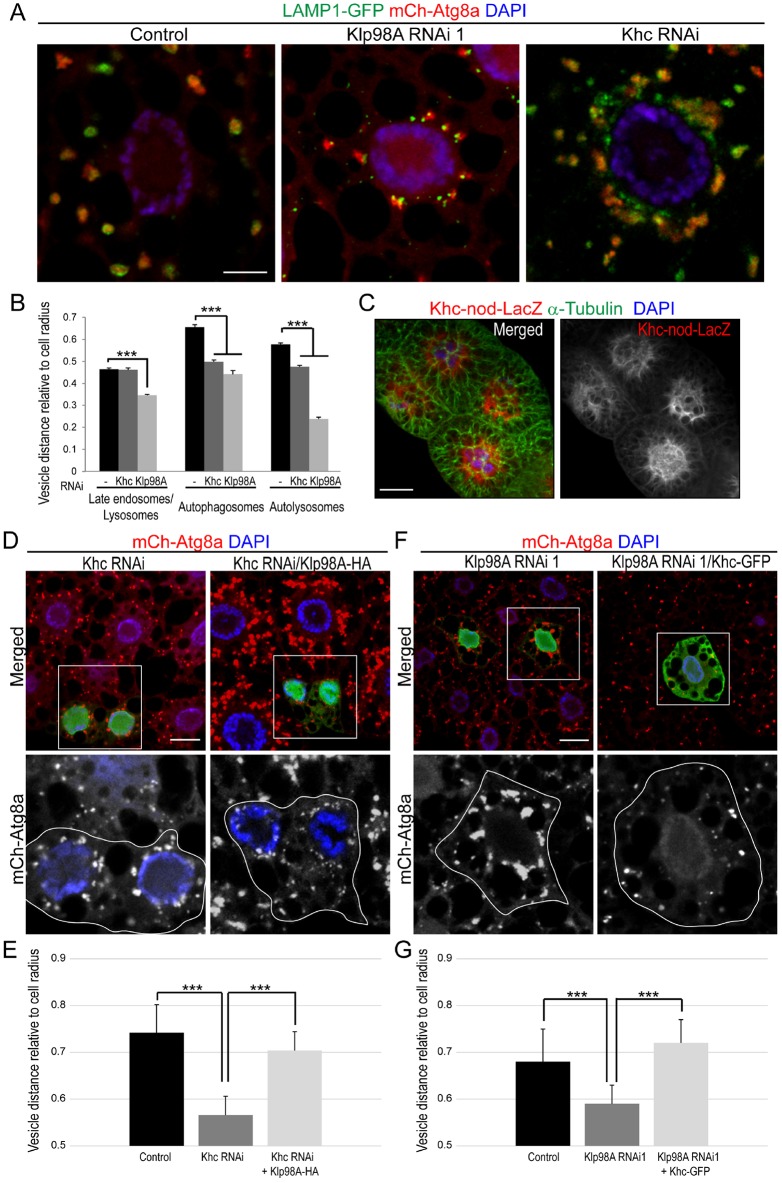
Loss of Klp98A induces a perinuclear distribution of autophagic vesicles. (A) Representative images of starved fat body cells expressing tissue-wide LAMP1–GFP (in green) and mCh–Atg8a (in red). Depletion of Klp98A or Khc leads to perinuclear accumulation of both LAMP- and Atg8a-positive structures. (B) Mean±s.e.m. distance from the nucleus of late endosomes and lysosomes, autophagosomes and autolysosomes in control, Klp98A- and Khc-depleted cells (representative images shown in panel A). n≥12 images of independent fat bodies. (C) Microtubule polarity in fat body cells. The minus-ends of microtubule are marked by Khc-nod–LacZ (in red and at right in grayscale). Fat body cells were stained for α-Tubulin (in green). A z-projection confocal image is shown. (D) Representative images of GFP-marked cell clones expressing Khc RNAi alone (left panel) or in combination with Klp98A–HA co-expression. Accumulation of mCh–Atg8a-positive vesicles (shown in grayscale below) around the nucleus upon Khc depletion is rescued by Klp98A overexpression. (E) Quantification (mean±s.e.m.) of the distance from the nucleus of mCh–Atg8a-positive vesicles relative to cell diameter for each genotype from images in D. n=10. (F) Rescue experiment showing depletion of Klp98A in GFP-marked clones, alone (left panel) or with Khc–GFP co-expression (right panel). mCh–Atg8a-positive vesicles from the boxed regions in those cells are shown in grayscale in the lower panels (the cell periphery is outlined). (G) Quantification (mean±s.e.m.) of the distance from the nucleus of mCh–Atg8a-positive vesicles relative to cell size for each genotype from images in F. n=10. Nuclei in A,C, D and F are labeled in blue (DAPI staining). ***P<0.001 (Student's t-test). Scale bars: 10 µm.

