Fig. 3.
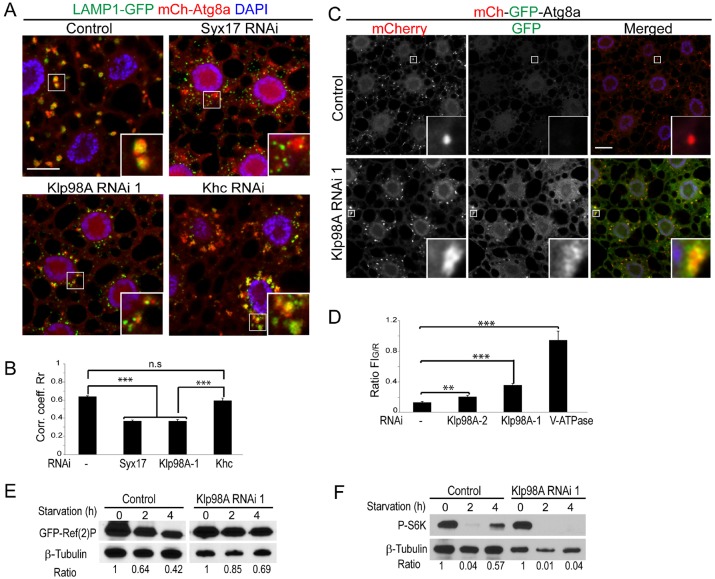
Loss of Klp98A reduces autolysosome formation, acidification and degradation. (A) Representative images of 4-h-starved fat body cells expressing GFP–LAMP1 (in green) and mCh–Atg8a (in red) under the fat-body-specific driver Cg-Gal4. Autolysosomes (labeled by both markers) are detected in control and Khc-depleted cells, whereas depletion of Klp98A reduces the colocalization between LAMP1- and Atg8a-positive structures (see insets) similar to the effect of Syx17 depletion. (B) Quantification (mean±s.e.m.) of the Pearson's correlation coefficient between LAMP1–GFP- and mCh–Atg8a-positive vesicles from experiments shown in A. n≥12 independent images analyzed per genotype. ***P<0.001 (Student's t-test). (C) Representative images of fat body cells expressing the double tagged mCh–GFP–Atg8a reporter after 4 h starvation. Silencing of Klp98A results in a block of GFP quenching (see insets). (D) Quantification (mean±s.e.m.) of the ratio between green and red fluorescence intensity for the mCh–GFP–Atg8a experiments shown in C and Fig. S3B. n≥7 independent images analyzed per genotype. **P<0.05; ***P<0.001 (Student's t-test). (E) Timecourse of GFP–Ref(2)P degradation during starvation-induced autophagy in control and Klp98A-depleted fat body cells. β-tubulin protein level was assessed as loading control. The ratio of GFP-Ref(2)P to β-tubulin is shown below each time point. (F) mTOR reactivation assay. Levels of phosphorylated S6K (P-S6K) were assessed during amino acid starvation (0, 2 and 4 h timecourse) in control cells and cells depleted for Klp98A. β-tubulin was used as loading control. The P-S6K to β-tubulin ratio is indicated below each condition. In A and C, nuclei are labeled in blue (DAPI staining). Scale bars: 10 µm.

