Fig. 5.
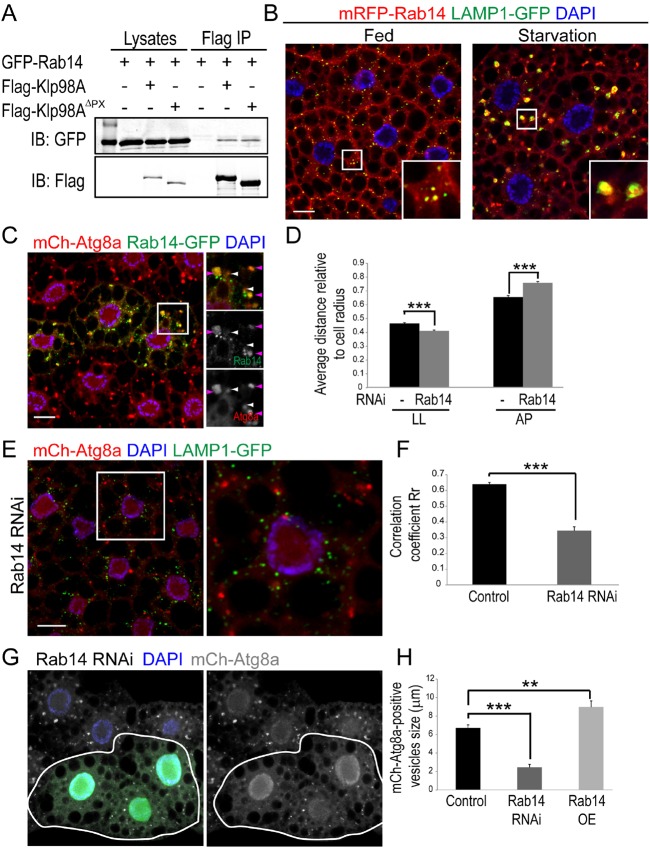
Rab14 functions in autophagosome maturation and intracellular distribution. (A) Co-immunoprecipitation (IP) from S2 cells of GFP–Rab14 with Flag–Klp98A and Flag–Klp98AΔPX. Extracts were immunoblotted (IB) for GFP or Flag. (B) Representative images of fat body cells expressing mRFP–Rab14 (red) and LAMP1–GFP (green) under nutrient-rich and 4-h starvation conditions. (C) Confocal image representative of the colocalization between a subset of Rab14–GFP (green) and mCh–Atg8a-positive vesicles (red) under starvation-induced autophagy in fat body cells. White arrowheads in the insets on the right highlight vesicles only containing mCh–Atg8a. Pink arrowheads indicate Rab14–GFP- and mCh–Atg8a-positive vesicles. (D) Quantification (mean±s.e.m.) of the intracellular distribution of late endosome or lysosomes (LL, positive only for LAMP1-GFP) and autophagosomes (AP, positive only for mCh-Atg8a) in control and Rab14-depleted fat body cells. n≥10 independent images analyzed per genotype. ***P<0.001 (Student's t-test). (E) Representative confocal images of larval fat body cells co-expressing mCh–Atg8a (red) and LAMP1–GFP (green) in cells depleted of Rab14 after 4 h starvation. The inset illustrates the absence of double-marker-positive autolysosomes. (F) Quantification (mean±s.e.m.) of LAMP1-GFP and mCh-Atg8a colocalization from the experiment shown in E. Pearson's correlation coefficient Rr was calculated using 10 independent samples for each genotype. n=10. ***P<0.001 (Student's t-test). (G) Representative confocal image showing the reduced size of mCh–Atg8a vesicles (gray) in Rab14-depleted (GFP-positive) cells relative to controls under 4-h starvation conditions. The grayscale image on the right shows mCh–Atg8a alone. The cell periphery is outlined. (H) Quantification (mean±s.e.m.) of autophagosome size in control, Rab14-depleted or Rab14-overexpressing cells after 4 h starvation. n≥10 independent images analyzed per genotype. **P<0.05; ***P<0.001, (Student's t-test). In panels B, C, E and G, nuclei are labeled in blue (DAPI staining). Scale bars: 10 µm.

