Fig. 6.
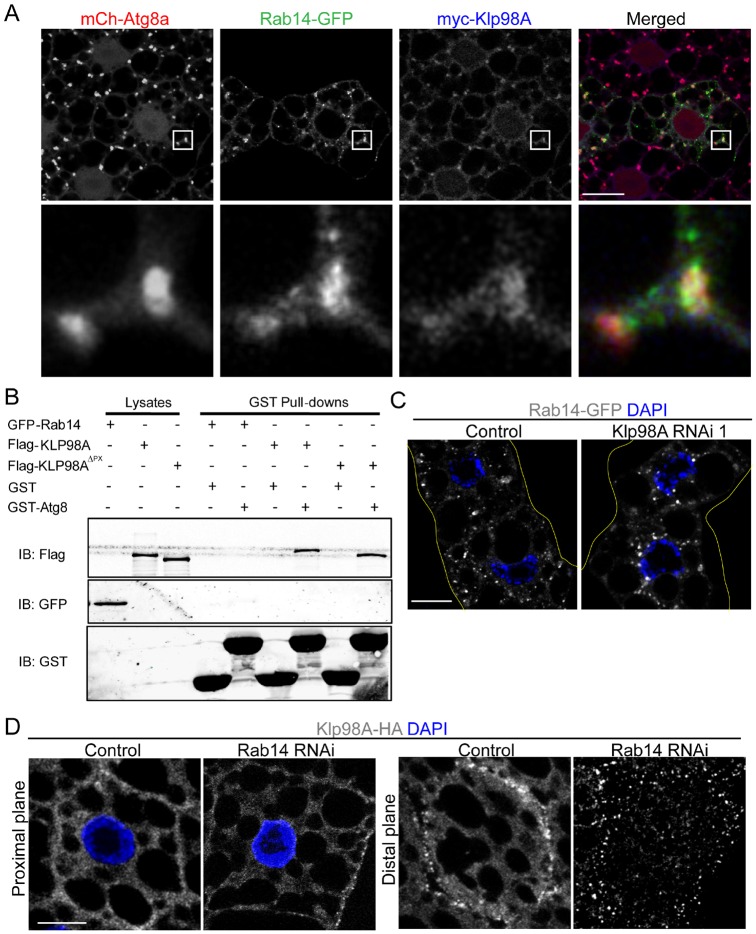
Klp98A interacts with Atg8a and acts upstream of Rab14. (A) Representative confocal image of fat body cells expressing mCh–Atg8a (red) and Rab14–GFP (green) together with tagged Myc–Klp98A (blue). The lower panels show a magnification of the boxed region highlighting colocalization between Myc–Klp98A, mCh–Atg8a and Rab14–GFP. (B) GST pulldown assays from S2 cells transfected with GFP–Rab14, Flag–Klp98A or Flag–Klp98AΔPX and GST–Atg8 showing an interaction of GST–Atg8 with Flag–Klp98A and Flag–Klp98AΔPX, but not with GFP–Rab14. IB, immunoblotting. (C) Representative confocal images showing intracellular localization of Rab14–GFP (grayscale) in 4-h-starved control and Klp98A-depleted cells. The cell outline is shown in yellow. (D) Representative confocal images of Klp98A–HA (grayscale) in control and Rab14-depleted cells after 4 h starvation. Single sections were taken at the nuclear level (proximal plane) and at cell periphery (distal plane). In C,D, nuclei are labeled in blue (DAPI staining). Scale bars: 10 µm.

