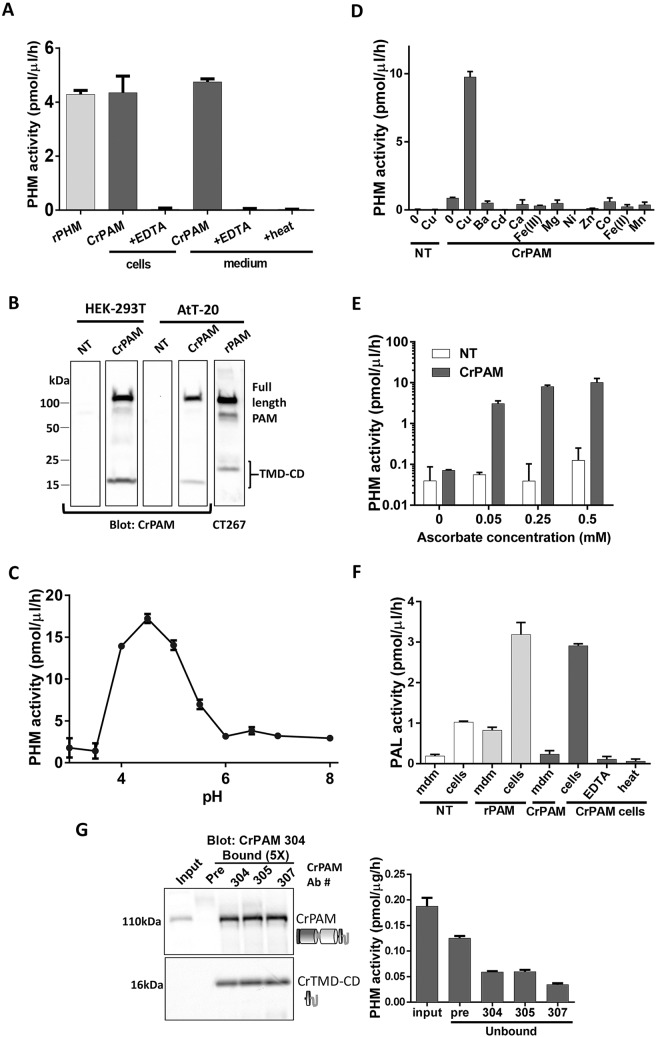
Fig. 3.
CrPAM encodes active PAM. (A) PHM activity was detected in spent medium and cell extracts of transiently transfected HEK-293T cells expressing CrPAM cDNA. EDTA or heat (100°C, 5 min) reduced activity in cell extracts and spent medium. (B) Immunoblot analysis of HEK-293T and AtT-20 cell lysates using an antibody against the CrPAM C-terminal domain (#304). Bands at 117-kDa and 16-kDa were detected only in transfected cell lysates. Lysate from AtT-20 cells expressing rPAM1 immunoblotted with an anti-C-terminal antibody (CT267) is shown for reference. (C) pH dependence of PHM activity in spent medium from HEK-293T cells transiently expressing CrPAM. NT, not transfected. (D) Spent medium from non-transfected (NT) or CrPAM-transfected HEK-293-T cells showed little or no PHM activity when a copper chelator (2 µM diethyldithiocarbamate) was added. The indicated metal salts (10 µM) were added to the reaction mixture in addition to the chelator. (E) CrPHM activity was dependent on inclusion of ascorbate (note the log scale); other single electron donors also support rPHM activity (Prigge et al., 2000). (F) PAL activity was detected in lysates of HEK-293T cells transiently expressing rPAM or CrPAM. PAL activity in lysates of HEK-293T cells expressing CrPAM was reduced by EDTA (5 mM) or heat. (G) Immunoprecipitation of CrPAM from Chlamydomonas cell lysates using affinity-purified C-terminal antibodies (Ab #304, #305 and #307) or pre-immune sera (Pre, as a control) showed enrichment of a 117-kDa band in the bound fractions, which were obtained from five-times more material than the input. A 16-kDa fragment (CrTMD-CD) was also seen in the bound fractions, indicating some cleavage of the full-length protein and separation of the enzymatic domains (which will not be bound by this antibody) from the cytosolic domain; the mid-region of the blot (with antibody heavy chain) is not shown. Immunoprecipitation reduced the amount of PHM activity in the unbound fractions. Data shown are mean±s.d. (n=2 or 3). Graphs are from one of two experiments, which yielded similar results.

