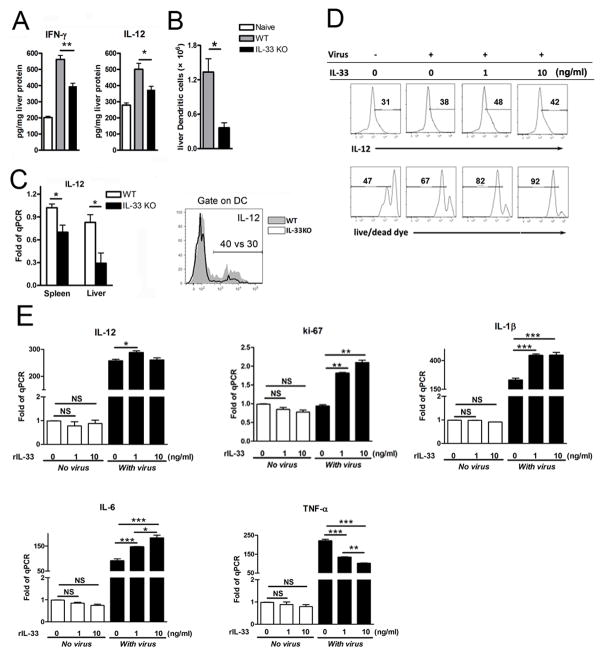
Figure 7. IL-33 controls DC proliferation and IL-12 production in acute LCMV infection.
(A) WT and IL-33−/− mice were infected and then sacrificed at 6 dpi. Liver IFN-γ and IL-12 protein levels were measured by Bio-plex. (B) Numbers of DCs in the liver at 6 dpi was determined by flow cytometry. (C) WT and IL-33−/− mice were infected and then sacrificed at 3 dpi. Gene expressions of IFN-γ and IL-12 in liver tissues were detected by real-time PCR. IHLs were stimulated with LPS and followed by intracellular IL-12 detection in CD11b+CD11c+ cells. (D) BMDCs were cultured with or without virus and IL-33 for 3 days. Cells were stimulated with LPS at last 4 hours in the presence of GolgiStop. All CD11c+ cells were gated first, and Live/dead cell dyes were used for discriminating between live cells and dead cells. (E) Gene expression of IL-12, IL-1β, IL-6, TNF-α and Ki-67 by BMDCs were also detected. Data are shown as mean + SEM of 3–5 mice/group, from single experiments representative of at least three experiments performed. A two-tailed t test was used for comparison of two groups. * P<0.05, ** P<0.01, ***P<0.001.

