
Fig. 1.
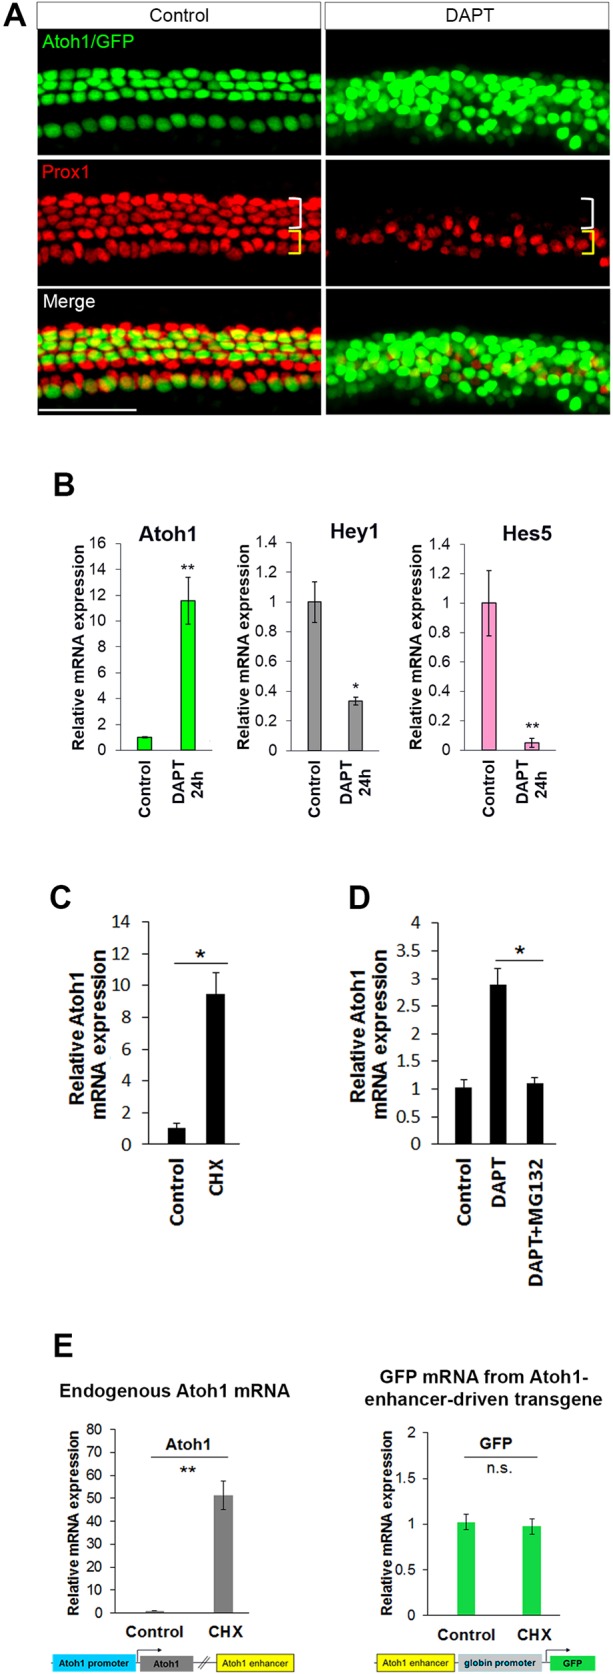
Derepression of Atoh1 in supporting cells is sufficient to drive expression and occurs through promoter elements, not through the 3′ autoregulatory enhancer. (A) P1 Atoh1 enhancer/β-globin promoter/GFP transgenic organ of Corti was cultured for 72 h in DMSO (control) or DAPT (γ-secretase inhibitor) and immunostained with anti-PROX1 antibody to label supporting cells (Deiters' and pillar cells). The appearance of ectopic GFP+ hair cell-like cells in DAPT is accompanied by loss of PROX1+ supporting cells (white bracket). (B-E) Changes in mRNA expression level were examined by real-time quantitative PCR (qPCR). (B) The observed transdifferentiation of supporting cells in A correlates with upregulation of Atoh1 and downregulation of Hes/Hey factors mRNA in FACS-purified supporting cells (p27/GFP+) after 24 h treatment with DAPT. n=4. (C) Inhibition of protein synthesis with cycloheximide (CHX) for 6 h induces Atoh1 expression in FACS-purified supporting cells (p27/GFP+). n=3. (D) Inhibition of protein degradation by MG132 prevents DAPT-induced upregulation of Atoh1 in FACS-purified supporting cells (p27/GFP+) treated for 12 h. n=3. (E) CHX induces endogenous Atoh1, but not the Atoh1 enhancer/β-globin promoter/GFP transgene. P1 cochlear organ cultures from Atoh1 enhancer/β-globin promoter/GFP mice were incubated without and with CHX for 6 h, after which organ cultures were dissociated and FACS sorted to eliminate hair cells. The GFP− population from these transgenic organs includes supporting cells, cells from the greater epithelial ridge and lesser epithelial ridge. Atoh1 and GFP levels were measured in GFP− cells (non-hair cells of the cochlear epithelia). n=4. All values are mean±s.e.m. *P<0.05, **P<0.005; n.s., not statistically significant. Scale bar: 100 µm. See also Fig. S1.