Fig. 2.
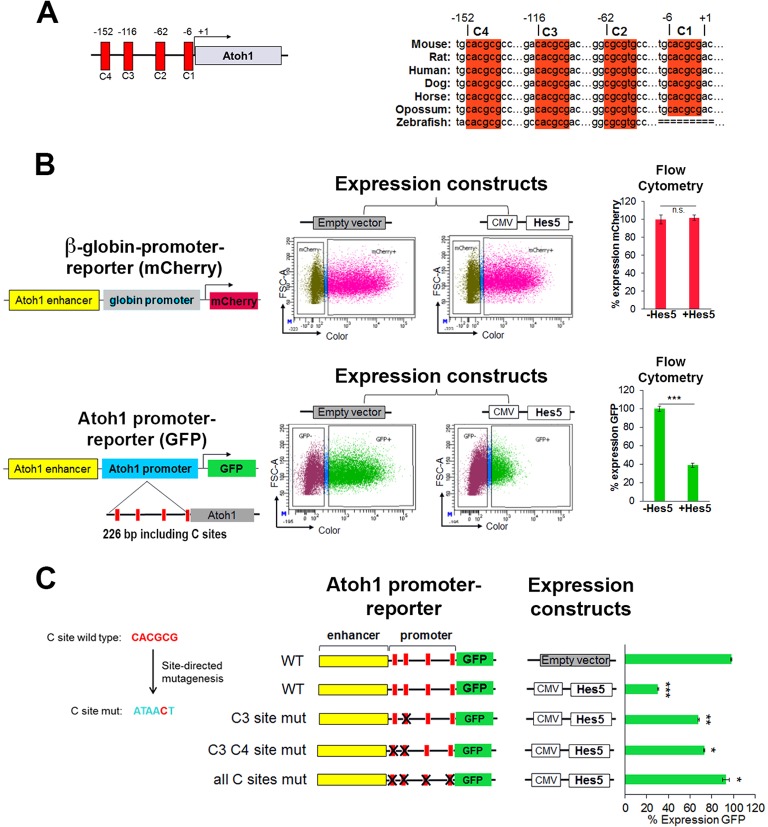
HES5 functions to repress Atoh1 through highly conserved binding sites in the promoter region. (A) Schematic of the murine Atoh1 promoter indicating the C-sites and their conservation among vertebrates. Numbers are relative to the transcription start site (+1) in mouse. (B) Ectopic Hes5 expression requires the Atoh1 promoter to repress Atoh1 expression in heterologous HEK 293 cells [compare β-globin promoter (top) with Atoh1 promoter (bottom)]. Reporters and expression constructs were transiently transfected and expression was quantified by flow cytometry. (Top) Reporter contains the Atoh1 enhancer and β-globin basal promoter driving the expression of mCherry. (Bottom) Reporter contains the Atoh1 enhancer and 226 bp of the Atoh1 promoter (containing the predicted C-sites) driving the expression of GFP. Reporters were cotransfected with a control (empty vector) or a plasmid expressing Hes5. The number of cells expressing GFP or mCherry was determined by flow cytometry after 48 h. Values are mean±s.e.m.; n=6. ***P<1×10⁻⁷. (C) Mutational analysis of C-site function. Five out of six nucleotides of each C-site were mutated. Quantification was performed as in B with the indicated plasmids reported as percentage of cells expressing GFP relative to the CMV-RFP co-transfected control (not shown) set to 100% in the absence of Hes5 expression (empty vector). Values are mean±s.e.m.; n=4. *P<0.0003, **P<2×10⁻⁵, ***P<4×10⁻⁷. See also Fig. S2.

