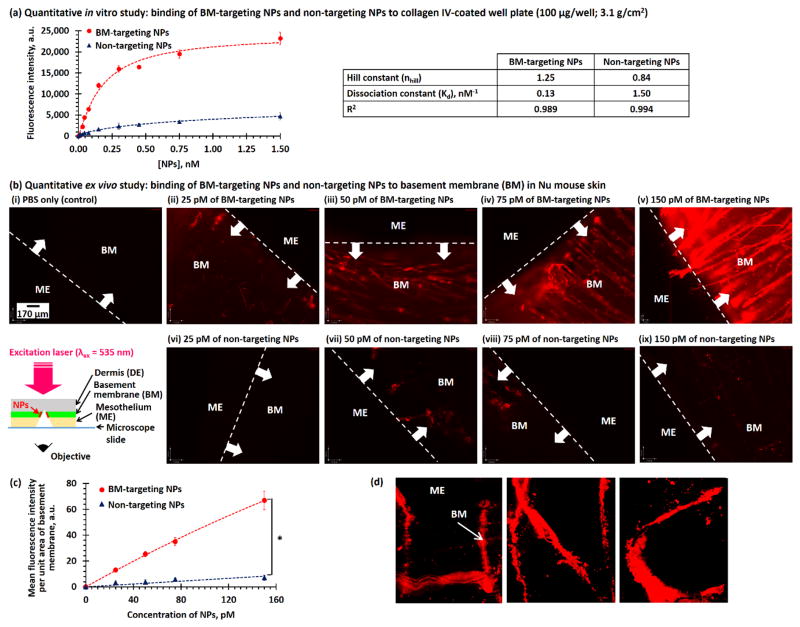
Figure 2.
(a) Concentration-dependent fluorescence intensities recorded for collagen IV-coated well plate after incubated with different concentrations of BM-targeting NPs and non-targeting NPs. The inset table summarized the binding affinities of two different NPs after fitted to Hill equation. (b) Florescence images recorded for basement membrane-exposed disease-free Nu mouse skin after incubation with (i) PBS and different concentrations of (ii–v) BM-targeting NPs and (vi–ix) non-targeting NPs. The insert cartoon shows the wide-field fluorescence imaging method. (c) Concentration-dependent fluorescence intensities at basement membrane of artificially damaged Nu mouse skin after incubation with different concentrations of BM-targeting NPs and non-targeting NPs. (d) Wide-field fluorescent images of an artificially-damaged Nu mouse skin with “U N C” letters. (N.B. * denotes p < 0.05, i.e. statistical significance. Fluorescence images were recorded using 200 ms exposure time.)

