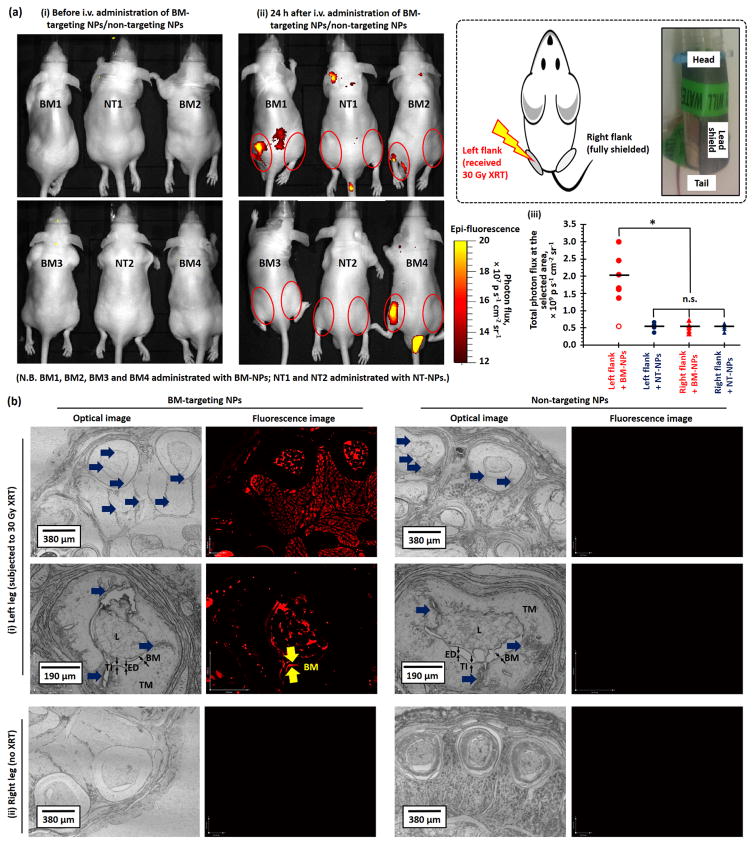
Figure 3.
(a) Representative in vivo optical and fluorescence overlaid images of high-dose X-ray irradiated healthy Nu mice recorded (i) pre-injection and (ii) 24 h after tail-vein i.v. injection of BM-targeting NPs (BM-NPs) or non-targeting NPs (NT-NPs). (See Figure S5 for the overlaid images of the remaining 6 Nu mice recorded 24 h after administration of BM-targeting NPs and non-targeting NPs.) 6 out of 7 of the X-ray irradiated mice showed increased photon flux (shown in yellow-red) at left flank (irradiated site) after the administration of the BM-targeting NPs. (iii) The total photon fluxes at the left and right flanks of the irradiated mice recorded 24 h after i.v. administration of BM-targeting NPs or non-targeting NPs, as quantified from the corresponding in vivo fluorescence images. The inset cartoon and digital image show the setup for site-specific XRT. (b) Representative low- and high-magnification optical and fluorescent histological images of (i) left and (ii) right leg histological sections that collected after the in vivo imaging study. The blue arrows labeled the vascular injury region. Fluorescence basement membrane can be easily identified from the high magnification fluorescence image of left leg section collected from mouse administrated with BM-targeting NPs. (N.B. n.s. denotes statistical insignificant; * denotes p < 0.05, i.e. statistical significance. L denotes lumen; TI denotes tunica intima which compose of endothelium (ED) and basement membrane (BM); TM denotes tunica media. Low magnification fluorescence images were recorded using 200 ms exposure time, high magnification images were recorded using 100 ms exposure time.)

