
Figure 1.
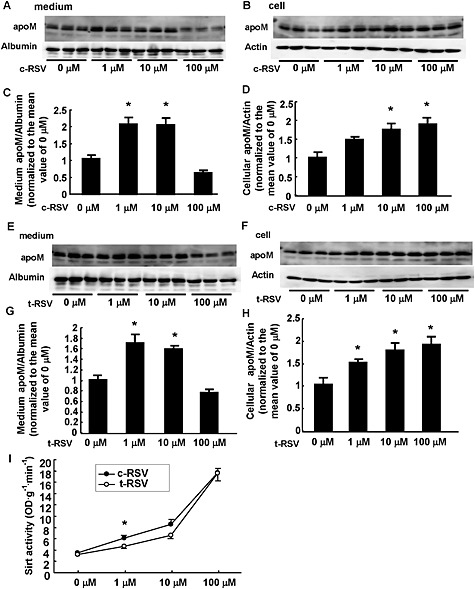
Effects of resveratrol on the levels of apoM in cells or culture medium of HepG2 cells. HepG2 cells were treated with FCS‐free medium containing various concentrations of c‐RSV (A–D) or t‐RSV (E–H), and after 16 h, the medium and the cells were collected and analysed by Western blotting. The intensity of the bands was quantified using Image J. For the medium apoM, albumin was utilized as a control; for the cellular apoM, β‐actin was utilized as a control. (A–D) Effects of c‐RSV. (A, C) Medium apoM levels. *P < 0.05, significantly different from 0 or 100 μM. (B, D) Cellular apoM levels. *P < 0.05, significantly different from 0 μM (n = 6 each group). (E–H) Effects of t‐RSV. (E, G) Medium apoM levels. *P < 0.05, significantly different from 0 or 100 μM. (F, H) Cellular apoM levels. *P < 0.05, significantly different from 0 μM (n = 6 each group). The data were normalized to the mean of the control group. (I) Nuclear extracts of HepG2 cells treated with various concentrations of c‐RSV or t‐RSV were analysed for SIRT activity (n = 6 each group). *P < 0.05, significantly different from t‐RSV at 1 μM.