
Figure 3.
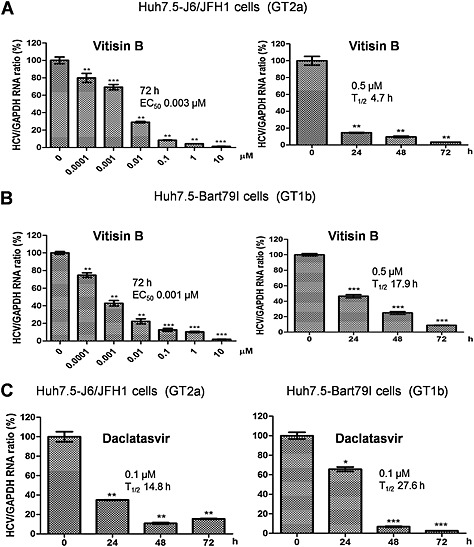
Inhibition of HCV replication by vitisin B. Dose–response graphs were generated by measuring the relative HCV and GAPDH RNA levels via real‐time qRT‐PCR analyses of either A Huh7.5‐J6/JFH1 or B Huh7.5‐Bart79I cells treated with increasing concentrations of vitisin B for 72 h. Time‐response graphs were also determined by measuring the relative HCV and GAPDH RNA levels via real‐time qRT‐PCR analyses of either A Huh7.5‐J6/JFH1 or B Huh7.5‐Bart79I cells treated with 0.5 μM vitisin B for increasing periods of time. C Time‐response graphs were determined by measuring the relative HCV and GAPDH RNA levels via real‐time qRT‐PCR analyses of either Huh7.5‐J6/JFH1 or Huh7.5‐Bart79I cells treated with 0.1 μM daclatasvir for increasing periods of time. * P < 0.05, ** P < 0.01, significantly different from control.