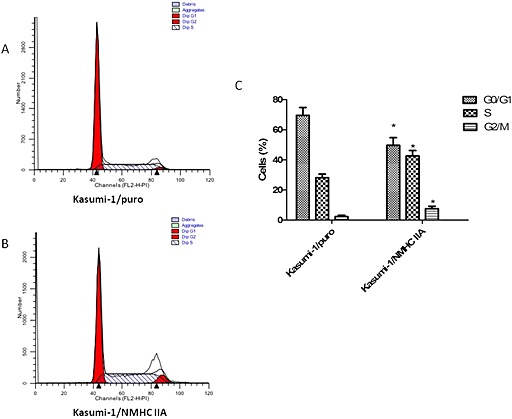
Figure 6.

The effect of myosin‐9 overexpression on cell cycles in leukaemia cells. The cell cycle distribution of (A) Kasumi‐1/NMHC IIA and (B) Kasumi‐1/puro was analysed with flow cytometry. (C) The percentage of cells in each of the phases of the cell cycles was calculated. Data presented are the means ± SD of results from three independent experiments. *P < 0.05, significantly different from Kasumi‐1/puro values.
