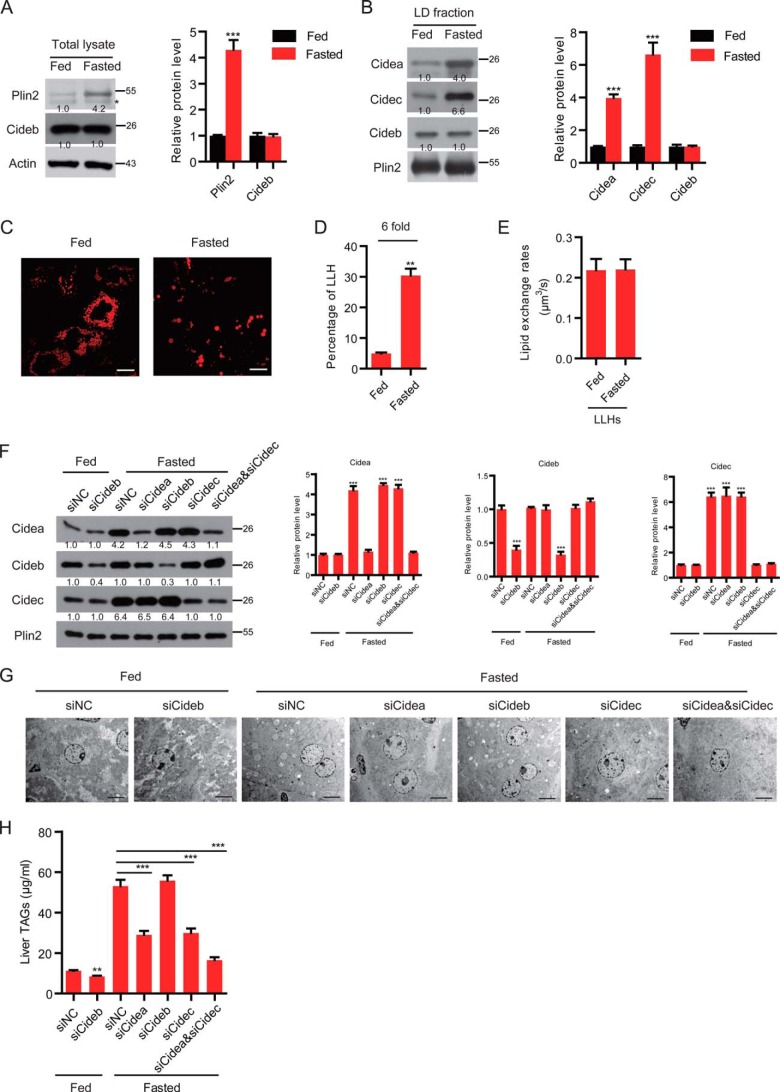
FIGURE 5.
Fasting induced the expression of Cidea and Cidec. A, left, representative Western blot showing the protein expression profiles of the liver total lysate. The asterisk designates a nonspecific band. Right, quantitative analysis of the relative level of Plin2 and Cideb. n = 3. Actin was used as a loading control. B, left, representative Western blot showing the protein expression profiles of the LD fraction. Right, quantitative analysis of the relative level of CIDE proteins. n = 3. Plin2 was used as a loading control. C, representative image showing the lipid droplet morphology in fed and fasted wild-type (WT) hepatocytes. Scale bar, 10 μm. D, ratio of LLHs was increased in fasted conditions (n = 4). E, lipid exchange rates in LLHs (n = 6). F, protein expression levels in the LD fraction of the liver. Wild-type mice were injected with different siRNAs. n = 3. Quantitation of the bands was performed using Quantity One software and are expressed as the fold change, after correction for Plin2 levels. Values are averages obtained from three independent experiments. G, electron microscopy (EM) showing the morphology of the liver. H, liver TAG level. n = 3. Quantitative data are presented as the mean ± S.E. Differences were considered significant at p < 0.05. **, p < 0.01; ***, p < 0.001.

