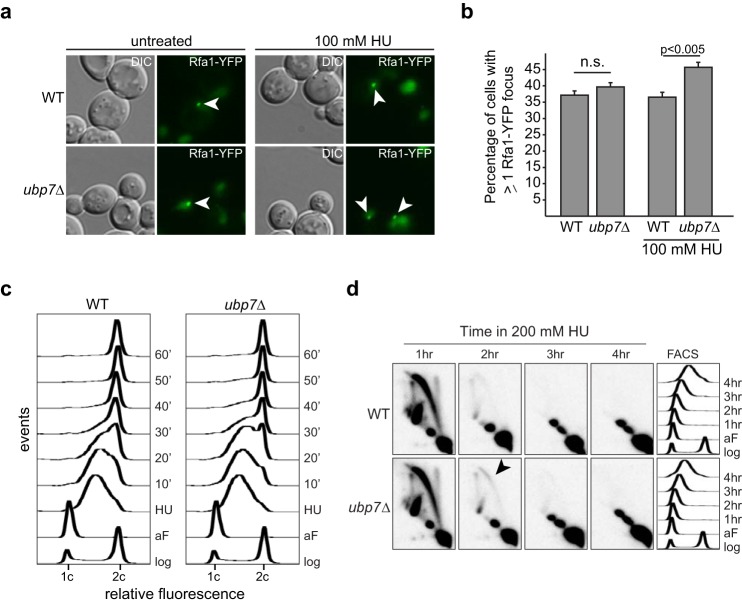
FIGURE 3.
S phase progression is altered in ubp7 cells. a, live-cell microscopy of wild-type and ubp7Δ Rfa1-YFP cells left untreated or after 2 h with 100 mm HU. A representative z plane of differential interference contrast (DIC)/YFP for each strain is shown. Arrowheads mark Rfa1 foci. b, quantification of a. The graph depicts the mean percentage of cells with an Rfa1-YFP focus ± S.E.M. (n (WT, untreated) = 1309, n (ubp7Δ, untreated) = 1359, n (WT, HU) = 1007, n (ubp7Δ, HU) = 1059). The indicated p values were calculated by Fischer's exact test. n.s., not significant. c, FACS analysis of WT and ubp7Δ cells in log phase (log), after α factor arrest (aF), and after release from 4 h of treatment with 200 mm HU (10, 20, 30, 40, 50, and 60 min). d, two-dimensional gel electrophoresis analysis with a probe recognizing the early origin of replication, ARS305, following HU treatment of α factor-arrested cells. The arrowhead indicates where bubbles are accumulating in ubp7Δ cells.

