FIGURE 2.
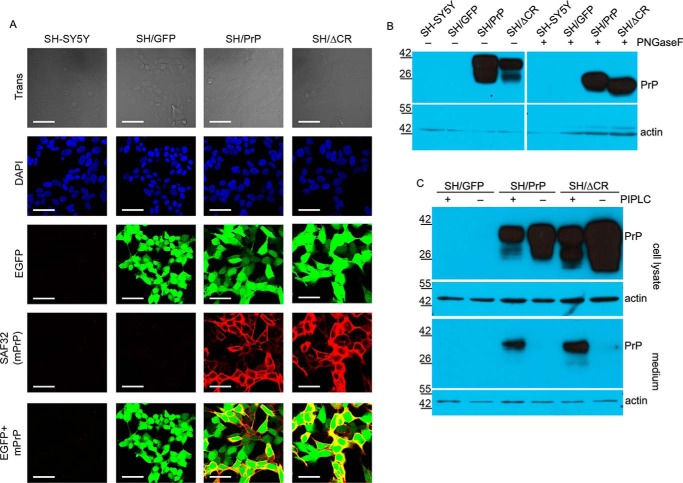
Analysis of the glycosylation, localization, and expression levels of prion proteins in SH/PrP-WT and SH/PrPΔCR cells. A, both PrP-WT and PrPΔCR are present on the cell surface, and their expressions are coupled with the marker EGFP. Shown are laser scanning confocal microscopy images. Nuclei (blue) and PrPs (red) are stained by DAPI and SAF32 anti-PrP antibody, respectively. Scale bar, 40 μm. B, both PrP-WT and PrPΔCR are complex-glycosylated. Shown is Western blotting analysis of extracts from various cells as indicated above the lanes, untreated (−) or treated (+) with PNGase F and visualized using SAF32 anti-prion antibody. The higher mobility of PrPΔCR caused by the deletion of the central region (aa 105–125) is more apparent after a PNGase F treatment. Endogenous PrP levels are below the detection limit. β-Actin was used as loading control (bottom). C, both PrP-WT and PrPΔCR are attached to the cell surface via a GPI anchor. Shown is Western blotting analysis of extracts (cell lysate) and supernatant medium (medium) from various cells as indicated above the lanes, untreated (−) or treated (+) with PI-PLC (top). β-Actin was used as loading control (bottom) in the case of cell lysates and to detect cell contamination in supernatant medium samples (note that PrP coming from cell contamination remained below the detection limit in the case of PI-PLC-untreated samples). A decrease in the PrP level is apparent in the lysates with a concurrent increase in the medium of PI-PLC-treated samples. B and C, numbers and marks on the left indicate the positions of the corresponding molecular size markers in kDa.

