FIGURE 5.
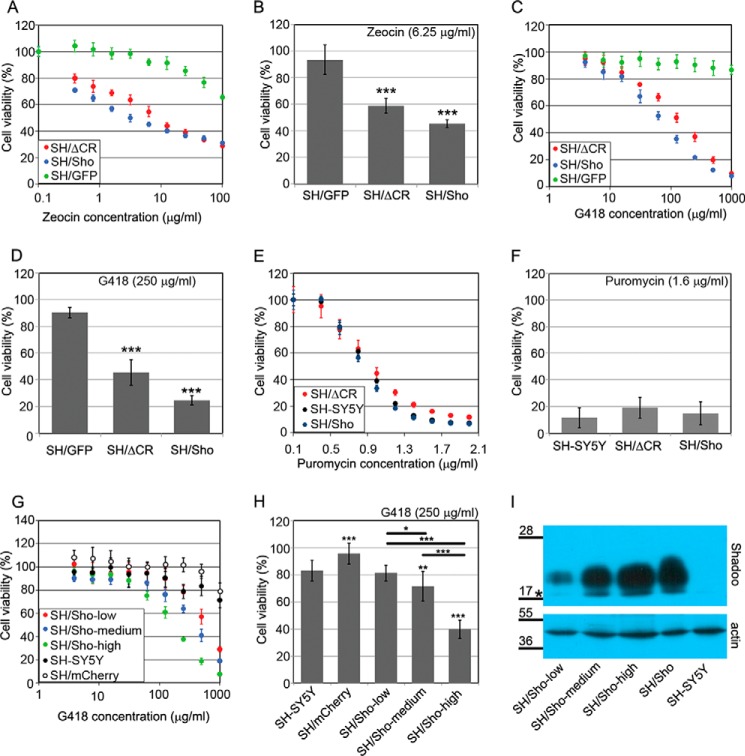
The overexpression of Shadoo, like PrPΔCR, sensitizes cells to Zeocin and G418. A–H, cytotoxicity assays, using PrestoBlue reagent. A and B, SH-SY5Y cells expressing either Shadoo (SH/Sho) or PrPΔCR (SH/ΔCR) are hypersensitive to Zeocin (48-h treatment). Of note, PrPΔCR expression in SH/ΔCR used in this experiment was lower than in the cells used for the experiments presented on Fig. 3 (data not shown). A, representative experiment carried out at Zeocin concentrations between 0 and 100 μg/ml on various cells as indicated. B, bars show the means ± S.D. (error bars) of cell viabilities measured at 6.25 μg/ml Zeocin concentration in n = 4 independent experiments. C and D, SH-SY5Y cells expressing either Shadoo (SH/Sho) or PrPΔCR (SH/ΔCR) are hypersensitive to G418 (48-h treatment). C, representative experiment carried out at G418 concentrations between 0 and 1000 μg/ml on various cells as indicated. D, bars show the means ± S.D. of cell viabilities measured at 250 μg/ml G418 concentration in n = 3 independent experiments. E and F, neither SH/Sho nor SH/ΔCR cells are hypersensitive to puromycin (24-h treatment). E, representative experiment carried out at puromycin concentrations between 0 and 2 μg/ml on various cells as indicated. F, bars show the means ± S.D. of cell viabilities measured at 1.6 μg/ml puromycin concentration in n = 6 independent experiments. G and H, Shadoo induces G418 hypersensitivity in a dose-dependent manner (48-h treatment). G, representative experiment carried out at G418 concentrations between 0 and 1000 μg/ml on SH/Sho-low, SH/Sho-medium, and SH/Sho-high cells. H, bars show the means ± S.D. of cell viabilities measured at 250 μg/ml G418 concentration in n = 3 independent experiments. a–h, 100% is the fluorescence value of untreated cells for each cell type. A, C, E, and G, values are means ± S.D. of corresponding replicas within the experiment. B, D, F, and H, for testing significance, values were compared with the control (i.e. leftmost values on each diagram) (SH/GFP (B and D) and SH-SY5Y (F and H)), and bars connected with brackets (H) were also compared using Tukey's honest significant difference post hoc test. *, p < 0.05; **, p < 0.01; ***, p < 0.001. I, relative Shadoo protein levels in SH/Sho cells. Shown is Western blotting analysis of extracts from SH/Sho-low, SH/Sho-medium, and SH/Sho-high as well as the parental SH/Sho and SH-SY5Y cells. *, a nonspecific band. Numbers and marks on the left indicate the positions of the corresponding molecular size markers in kDa. β-Actin was used as a loading control.

