FIGURE 3.

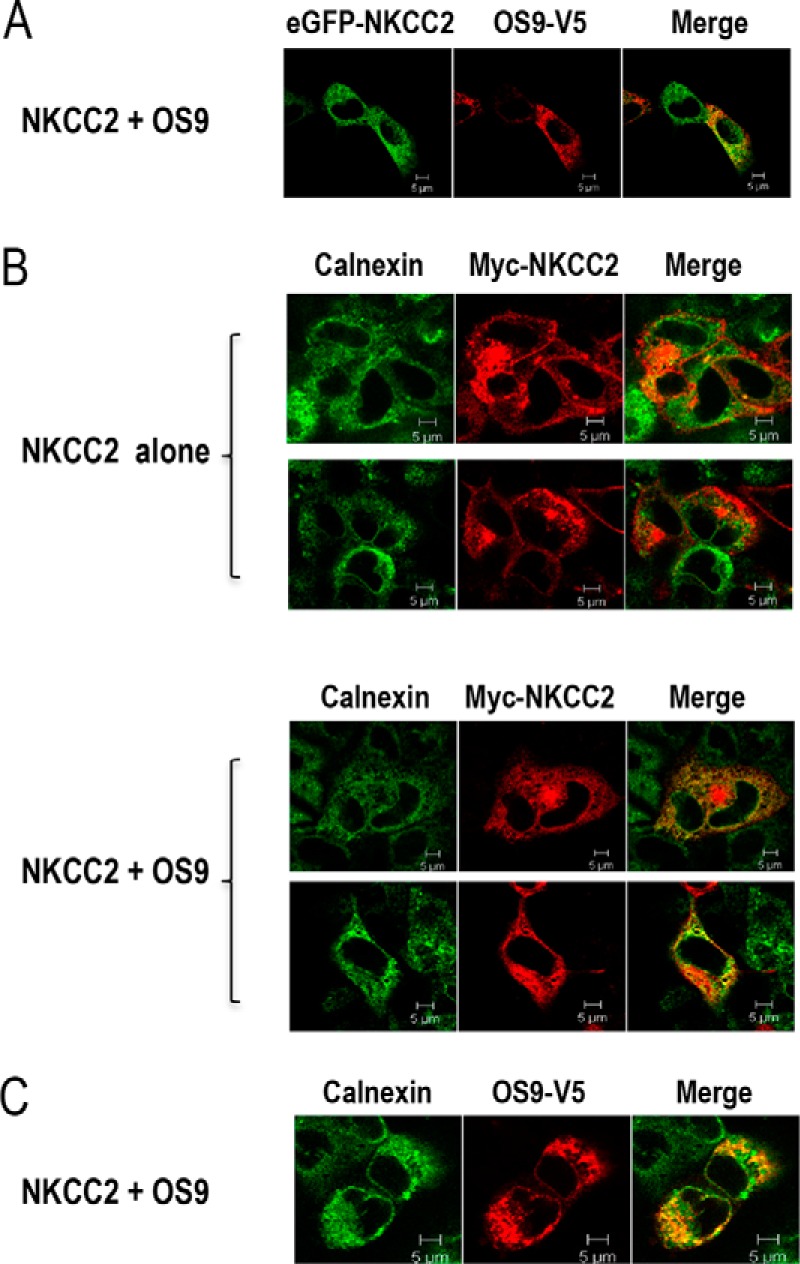
OS9 co-localizes with NKCC2 in the endoplasmic reticulum. A, immunofluorescence confocal microscopy showing distribution of NKCC2 and OS9 in OKP cells. OKP cells were transfected with NKCC2 N-terminally tagged with EGFP (green) and OS9-V5. Fixed and permeabilized cells were stained with mouse anti-V5 for OS9 (Texas Red). The yellow color (merged image) indicates co-localization of the proteins. B, effect of OS9 on subcellular distribution of NKCC2. OKP cells transfected with Myc-NKCC2 alone or with OS9 were stained with mouse anti-Myc (Texas Red; red) and rabbit anti-calnexin (fluorescein isothiocyanate; green). The yellow color indicates overlap between the Myc tag of NKCC2 protein (green) and the ER marker (red), representing co-localization of the proteins. C, subcellular distribution of OS9 in OKP cells. OKP cells overexpressing NKCC2 and OS9-V5 were stained with mouse anti-V5 (Texas Red; red) and rabbit anti-calnexin (FITC; green). The yellow color in the merged image indicates co-localization of OS9 (red) with the ER marker (green). The white scale bars represent 5 μm.
