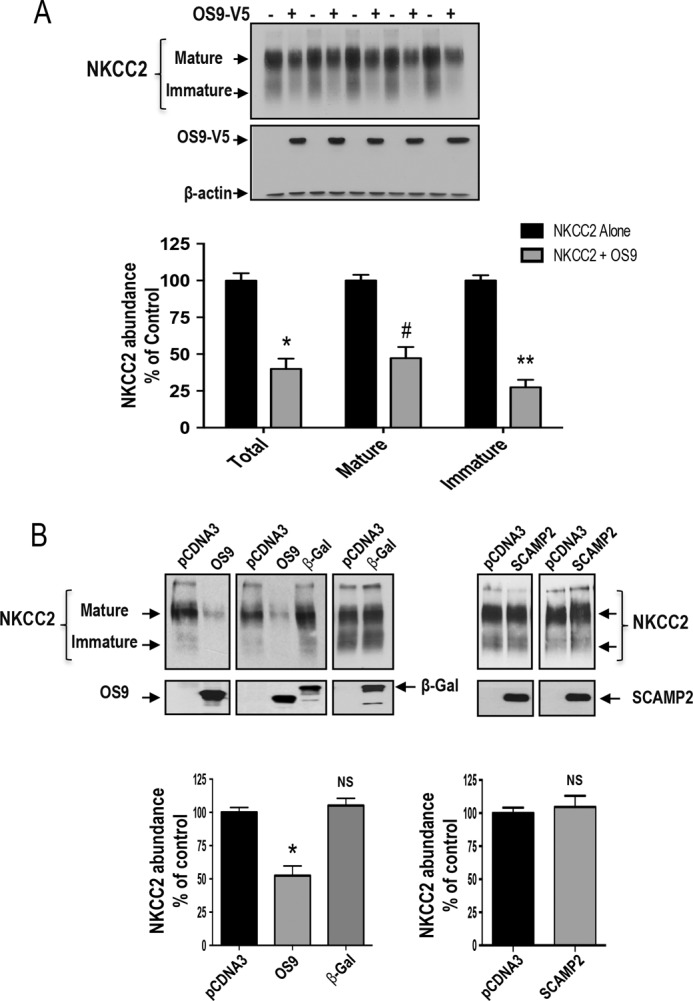
FIGURE 4.

Regulation of steady-state protein level of NKCC2 by OS9. A, OS9 co-expression decreases the expression of NKCC2 proteins. Upper panel, representative immunoblotting analysis showing the effect of OS9 overexpression on NKCC2 protein abundance in OKP cells. Cells were transfected with Myc-NKCC2 alone or in the presence of OS9-V5. 48 h post-transfection, total cell lysates were subjected to immunoblotting analysis for Myc-NKCC2, OS9-V5, and actin. Actin was used as a loading control Lower panel, quantitation of steady-state mature, immature, and total NKCC2 expression levels with or without OS9 co-expression. NKCC2 expression is given as the percentage of that observed in controls co-expressing empty vector (n = 6; mean ± S.E.). Data are expressed as a percentage of control ±S.E. *, p < 0.0004; #, p < 0.0003; **, p < 0.0001 versus control. B, the effect of OS9 on NKCC2 is specific. Upper panel, representative immunoblotting analysis showing the effect of OS9, β-galactosidase (β-gal), and SCAMP2 on NKCC2 protein abundance in OKP cells. Cells were co-transfected with Myc-NKCC2 and the empty vector (pCDNA3) or with OS9.1, β-galactosidase-V5 (β-gal), or SCAMP2-V5 cDNAs. Bottom, summary of results. NS, not significant versus NKCC2 alone; *, p < 0.001 versus NKCC2 alone. NKCC2 alone, n = 8; NKCC2 with OS9.1, n = 8; NKCC2 with β-gal, n = 5. In contrast to OS9, SCAMP2-V5 overexpression had no effect NKCC2 protein abundance. OKP cells were co-transfected with Myc-NKCC2 (0.1 μg/well) alone or in combination with SCAMP2-V5 (0.3 μg/well). Bottom, summary of results. NS, not significant versus NKCC2 alone (NKCC2 alone, n = 5; NKCC2 with SCAMP2-V5, n = 5). Error bars, S.E.
