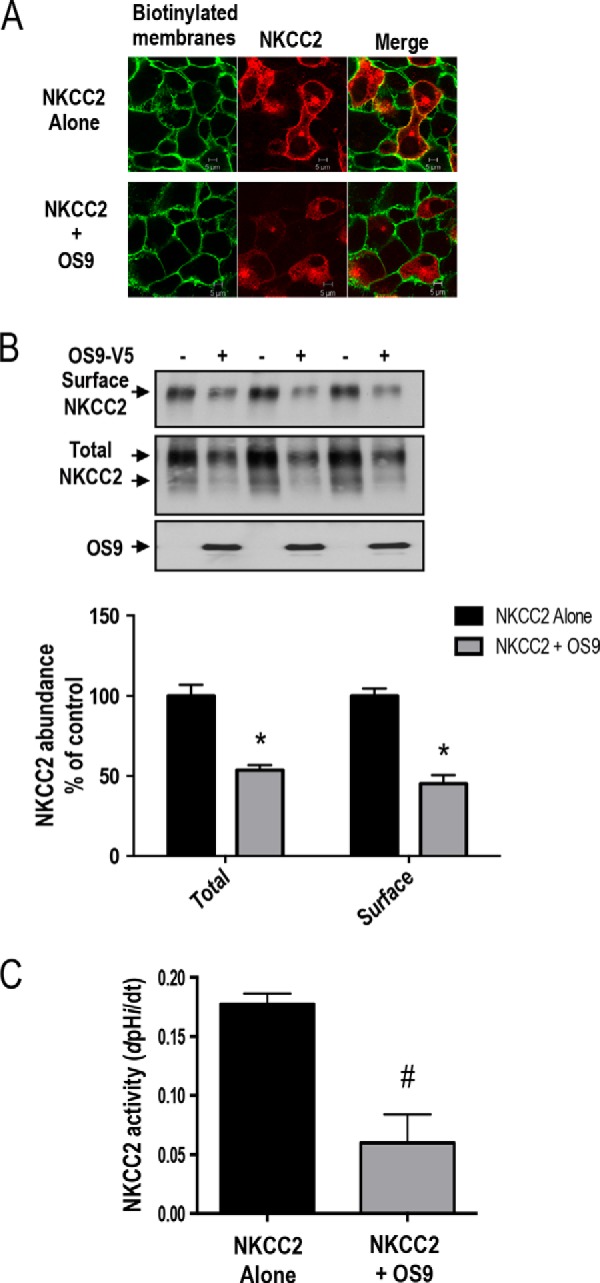
FIGURE 5.

OS9 decreases NKCC2 cell surface expression and activity. A, effect of 0S9 on subcellular distribution of NKCC2. OKP cells were transfected with Myc-NKCC2 (red) alone or with SCAMP2-V5. Membrane proteins of confluent cells were biotinylated at 4 °C with the biotinylation reagent sulfo-NHS-SS-biotin. Then the monolayers were fixed and stained for cell surface biotin (avidin-Cy2; green). The stained specimens were evaluated by confocal microscopy. Optical sections (xy) at the cell surface are depicted for the Texas Red channel (red), Cy2 channel (red), and a merged channel. B, total and surface NKCC2 proteins are down-regulated by OS9. OKP cells were co-transfected with Myc-NKCC2 (0.1 μg/well) alone or in combination with OS9 (0.3 μg/well) as indicated. Biotinylated proteins were recovered from cell extracts by precipitation with NeutrAvidin-agarose. NKCC2 proteins on the cell surface were detected by immunoblotting with Myc antibody. An aliquot of the total cell extract from each sample was also run on a parallel SDS gel and Western blotted for total NKCC2 expression. Bottom, densitometric analysis of total and surface NKCC2 from cells expressing NKCC2 alone or with OS9. Data are expressed as a percentage of control. *, p < 0.004 versus NKCC2 alone (n = 3). C, measurement of Na-K-2Cl co-transport activity in OKP cells expressing NKCC2 alone or with OS9 proteins. Each bar represents the mean ± S.E. rates of cell pH recovery (dpHi/dt in pH units/min) from NH4+-induced alkaline load of three independent experiments. #, p < 0.03 versus NKCC2 alone (n = 3). Error bars represent S.E.
