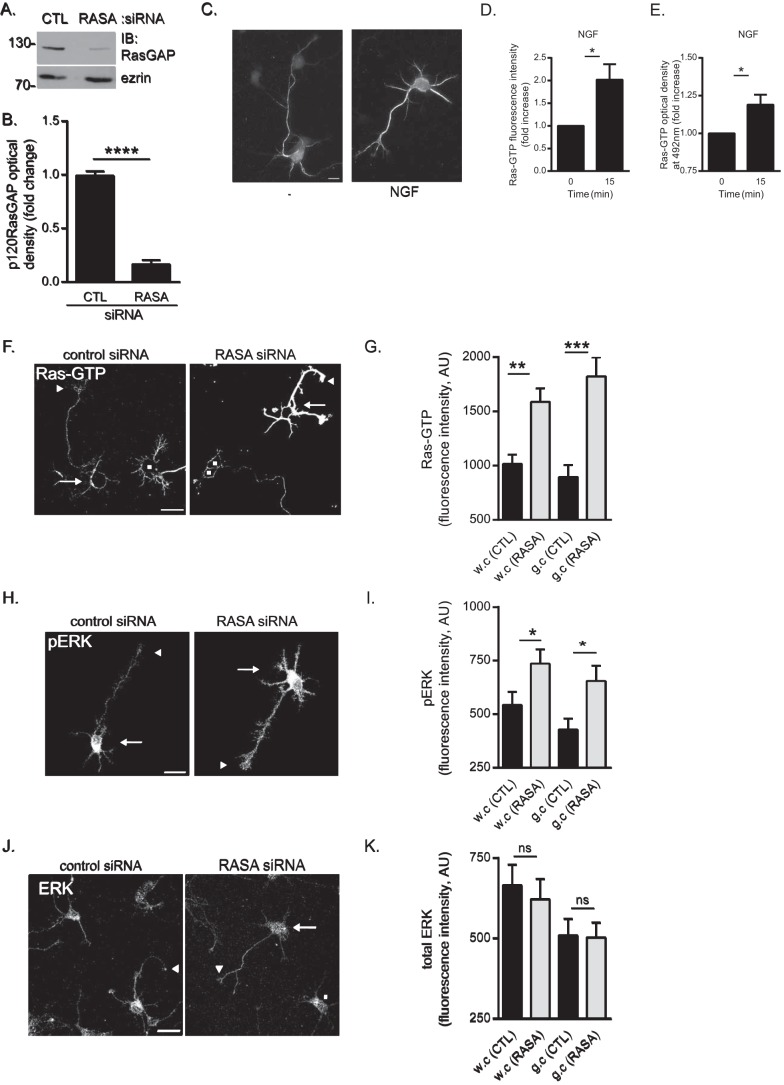
FIGURE 4.
p120RasGAP is required to maintain basal Ras and ERK activities in cortical neurons. Control (CTL) or p120RasGAP (RASA) siRNA was electroporated in neurons at 0 DIV with pGFP as a transfection reporter plasmid. A, total cell lysates were resolved by SDS-PAGE and immunoblotted (IB) with antibodies against p120RasGAP and ezrin as a loading control. B, quantitative densitometry of A represented as the -fold change (mean ± S.E.) relative to control siRNA measured in 10 independent experiments (unpaired Student's t test; ****, p < 0.0001). C, cortical neurons were stimulated with NGF (100 ng/ml) or left unstimulated (−) for 15 min. Neurons were immunostained with anti-Ras-GTP antibodies. Scale bar = 10 μm. D, Ras-GTP fluorescence intensity and the -fold increase (mean ± S.E.) relative to unstimulated control neurons was measured in at least three independent experiments (n > 50 neurons/condition; unpaired Student's t test; *, p < 0.05). E, the levels of Ras-GTP in each cell lysate were evaluated by G-LISA assay by measuring the absorbance at 492 nm, which is represented as the -fold change (mean ± S.E.) relative to the unstimulated lysate (0 min) in at least three independent experiments (unpaired Student's t test; *, p < 0.05). F, neurons were immunostained with anti-Ras-GTP antibodies. Arrows indicate cell bodies, arrowheads indicate growth cones of GFP-expressing neurons, and squares represent untransfected neurons. Scale bar = 50 μm. G, the Ras-GTP fluorescence intensity (arbitrary units (AU), mean ± S.E.) of GFP-expressing neurons in F was measured in whole cells (w.c) and growth cones (g.c) in three independent experiments (n = 31, 32, 31, and 32 neurons; two-way ANOVA, Fisher's least significant difference post test; **, p < 0.0004; ***, p < 0.0001). H, neurons were immunostained with antibodies against pERK. Arrows indicate cell bodies, and arrowheads indicate growth cones. Scale bar = 50 μm. I, pERK fluorescence intensity (mean ± S.E.) of GFP-expressing neurons in H was measured in whole cells and growth cones in three independent experiments (n = 35, 36, 30, and 35 neurons; two-way ANOVA, Fisher's least significant difference post test; *, p < 0.05). J, neurons were immunostained with antibodies against ERK. Arrows and arrowheads indicate cell bodies and growth cones of GFP-expressing neurons, respectively, and squares indicate untransfected neurons. Scale bar = 50 μm. K, the total ERK fluorescence intensity (mean ± S.E.) of GFP-expressing neurons in J was measured in whole cells and growth cones (n = 41, 38, 41, and 38 neurons) in three independent experiments (two-way ANOVA, Tukey's post test; ns, not significant).

