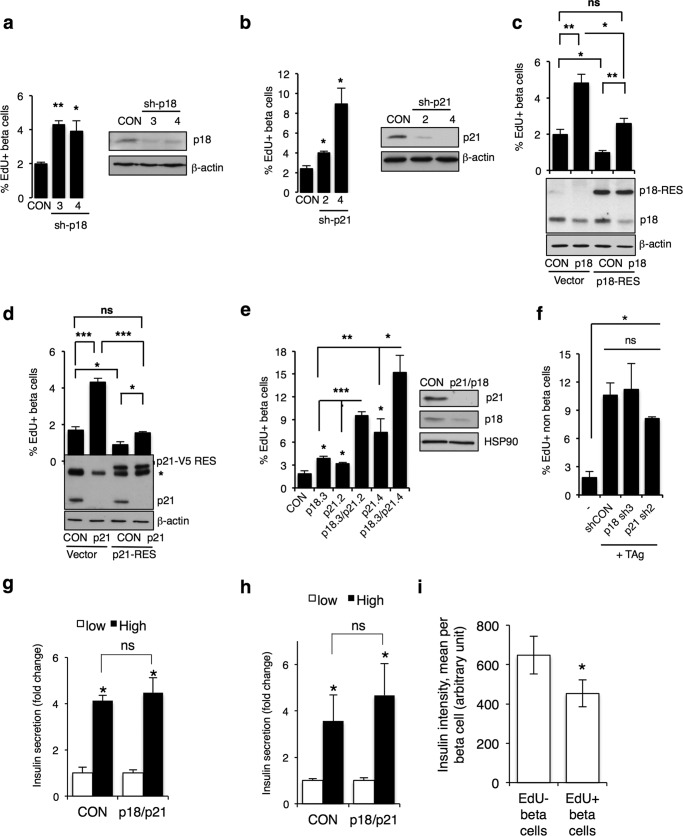
FIGURE 5.
p18 and p21 cooperate to prevent human beta cell proliferation. a, histogram showing percentage of EdU+ beta cells following silencing with additional shRNA targeting p18 with Western blots showing p18 knockdown. b, histogram showing percentage of EdU+ beta cells following silencing with additional shRNA targeting p21 with Western blots showing p21 knockdown. c and d, histogram showing percentage of EdU+ beta cells following silencing p18 (c) or p21 (d), in the presence of the corresponding shRNA-resistant cDNA tagged with V5 (p18-RES, p21-RES). Empty vector control (vector) is shown. Western blots showing expression of endogenous and exogenous p18 and p21 are shown below. Note that the V5 tag shifts the shRNA-resistant protein higher on the blot. e, histogram showing percentage of EdU+ beta cells following silencing p18 with one shRNA (p18.3) or p21 with two shRNAs (p21.2 and p21.4) alone or together. Western blot at right shows knockdown of p18 and p21 in p18.3 + p21.4 condition. * indicates a nonspecific band detected with p21 antibody. n = 3 independent biological replicates done in triplicate for c–e. n.s., p > 0.05; *, ≤ 0.05; **, ≤ 0.01; ***, ≤ 0.001, two-tailed unpaired t test. f, histogram showing the percentage of EdU+, TAg+, insulin-negative cells infected with control non-silencing shRNA (CON) or shRNA targeting p18 (p18 sh3) or p21 (p21 sh2). ns, not significant, p ≥ 0.05, two-tailed unpaired t test. g, islets were dissociated and plated on poly-d-lysine-coated plates and infected with TAg in combination with empty vector control (CON) virus, or p18 and p21 silencing. GSIS was performed following 3 days. h, intact islets were infected with TAg in combination with control vector (CON) or p18 and p21 silencing. GSIS was performed 10 days after infection. Bars indicate the mean of three independent donors ± S.E. i, insulin staining intensity in EdU+ and EdU-beta cells, calculated with Columbus software. Bars represent the mean of insulin intensity per cell, based on all insulin+ cells in the experiments shown in e (TAg + sh-p18.3 + sh-p21.4). ns, not significant, p ≥ 0.05; *, p ≤ 0.05, two-tailed unpaired t test.

