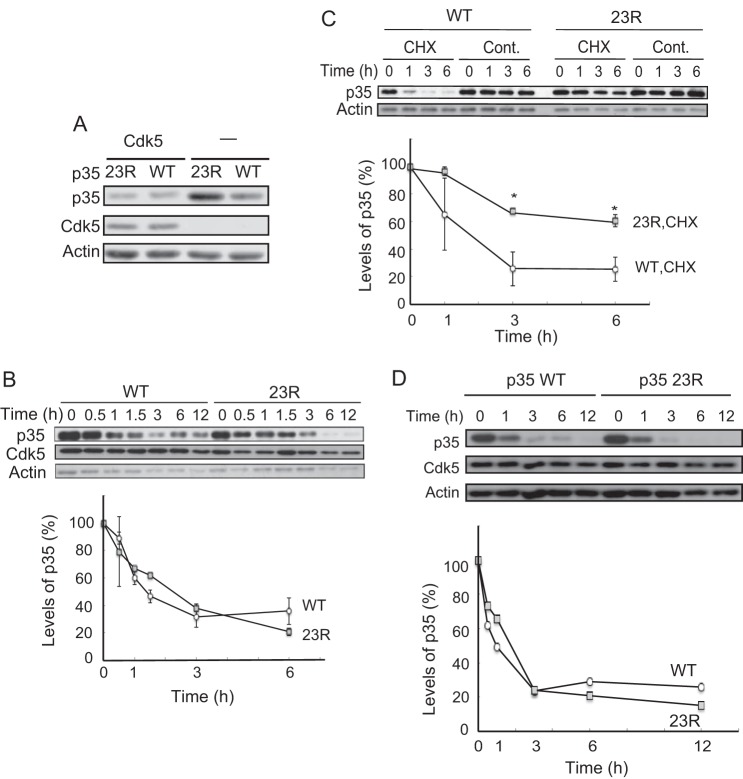
FIGURE 5.
Degradation rate of p35 or p35 23R in the presence or absence of Cdk5. A, expression levels of p35 or p35 23R in the absence of Cdk5 in Neuro2a cells. Immunoblotting with anti-p35 shown in the top, Cdk5 is in the middle, and actin is at the bottom. B, p35 (WT) and p35 23R have the same degradation rate when co-expressed with Cdk5. Neuro2a cells expressing Cdk5 and p35 (WT or 23R) were treated with CHX for the indicated times. The quantification is shown in the lower panel (mean ± S.E., n = 3). C, p35 23R is stable more than p35 in the absence of exogenous Cdk5. Neuro2a cells expressing p35 (WT) or p35 23R were treated with CHX for the indicated times. p35 was detected by immunoblotting with anti-p35. Actin is the loading control. Quantification is shown in the lower panel (mean ± S.E. n = 3. *, p < 0.05, Tukey's post hoc test). D, degradation of p35 23R in primary neurons. p35 and p35 23R are degraded at the same speed in primary cortical neurons. Cerebral cortical neurons expressing p35-HA (WT) or p35-HA 23R were treated with CHX for the indicated times. p35 (WT) and p35 23R were detected by immunoblotting with anti-HA antibody. Cdk5 and actin are shown in middle and lower panels, respectively. Quantification is shown below (mean ± S.E., n = 3).

