FIGURE 2.
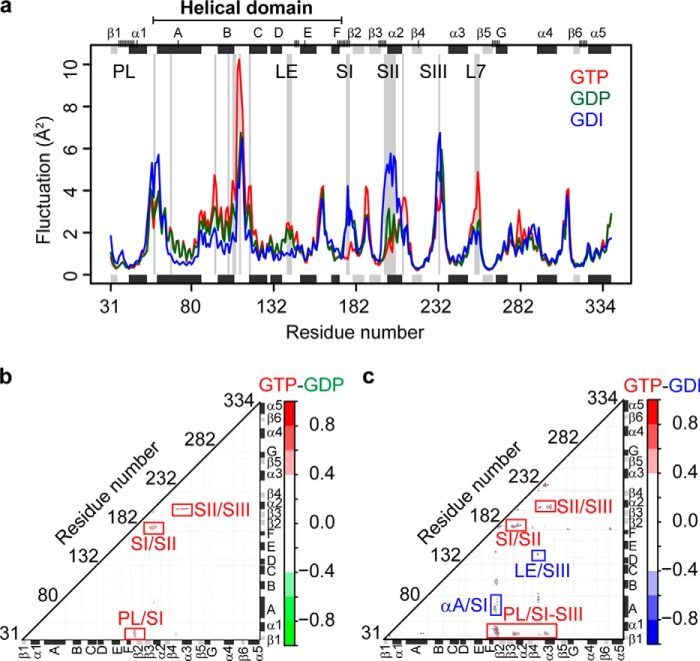
State-specific residue fluctuations and dynamic couplings in Gα from molecular dynamic simulations. a, ensemble averaged fluctuation analysis reveals structural regions with significantly distinct flexibilities in GTP (red), GDP (green), and GDI (blue) states. Sites with a p value < 0.05 are highlighted with a light gray background on the main plot. Short vertical tick lines on the top axis indicate the location of nucleotide binding site residues. Marginal black and gray rectangles indicate the location of major α helix and β strand secondary structure elements. b and c, state-specific residue couplings. Difference correlation values between GTP and GDP (b) and between GTP and GDI (c) states are shown. Major regions displaying distinct couplings are indicated with red (GTP) and blue (GDI) labels. Note that no major GDP specific couplings were evident from comparison with GTP (b) or GDI (data not shown) states.

