FIGURE 6.
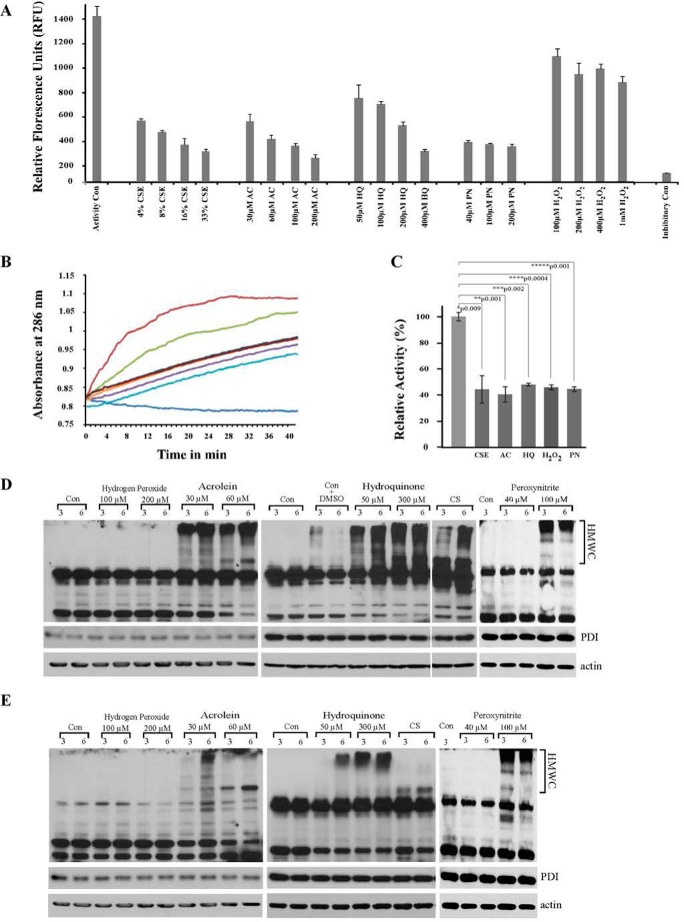
Radicals found in CS have inhibitory effect on PDI activity both in vitro and in vivo. A, recombinant PDI was treated or not with indicated concentrations of HQ, AC, PN, H2O2, or CSE for 15 min; insulin was added for an additional 15 min, and by the end of the incubation PDI reductase activity was measured by colorimetric assay, which reflects the amounts of reduced insulin. S.D. were calculated from at least three independent experiments. B, recombinant PDI was treated or not with 50 μm HQ, 30 μm AC, 40 μm PN, 100 μm H2O2, or 10% CSE for 15 min; DrRNase was co-incubated with treated or not treated PDIs for 30 min. Isomerase activity of PDI was determined by measuring continuously the absorbance increase at 286 nm following addition of RNase substrate cCMP for indicated times. Brown trace represents native RNase; blue trace represents DrRNase; green trace represents DrRNase+PDI; purple trace represents DrRNase+PDI+CSE; cyan trace represents DrRNase+PDI+AC; dark red trace represents DrRNase+PDI+PN; orange trace represents DrRNase+PDI+HQ; and dark blue trace represents DrRNase+PDI+H2O2. Graph is representative of three independent experiments. C, relative PDI activity, where initial rate of cCMP hydrolysis by RNase was calculated during lag phase (the first 10 min of the curve); relative RNase activity restored by untreated PDI is considered as 100%. Standard deviations were calculated from three independent experiments. Statistical significance between the treated and control groups was calculated using the “Student's t test. D and E, MLE12 cells were exposed or not to PN and H2O2,and to tar gases of CS, HQ, and AC for indicated times, lysed, resolved on gel under non-reducing (D) or reducing (E) conditions, and immunoblotted for the ER chaperone PDI. PDI was found in multiprotein complexes (HMWC) in HQ, AC, and high concentrations PN-treated cells. Significant amounts of HMWC from AC-, HQ-, and PN-treated cells were boiling- and detergent-resistant, attesting to irreversible nature of PDI-acrolein or other adducts. Actin was used as loading control for non-reducing gels. Middle panels of D and E represent additional loading controls, where the same amounts of lysates were resolved on 10% reducing gels and probed for PDI. Con represents control cultures. Please note the control with added DMSO was used only as a control for the higher concentration of hydroxyquinones during HMWCs formation and not for the rest of the radicals; those stock solutions were prepared or provided by the company as aliquot solutions. This was included because DMSO has been shown to be cytotoxic (acute and chronic) to the cells if the levels exceed 1% (v/v) (93, 94). Dilution of 10 mm stock solution of HQ in DMSO resulted in 3% DMSO in culture to reach 300 μm HQ (and 0.5% to reach 50 μm HQ). Cells treated with 3% DMSO were therefore used as a control to ascertain that HMWCs are predominantly formed as a result of exposure to 300 μm HQ and not DMSO. Comparison of Control-DMSO and 300 μm HQ HMWCs clearly proves that the changes we are seeing are due to the HQ and not DMSO. Addition of 0.5% DMSO had no effect on HMWC formation (data not shown).

