
FIGURE 4.
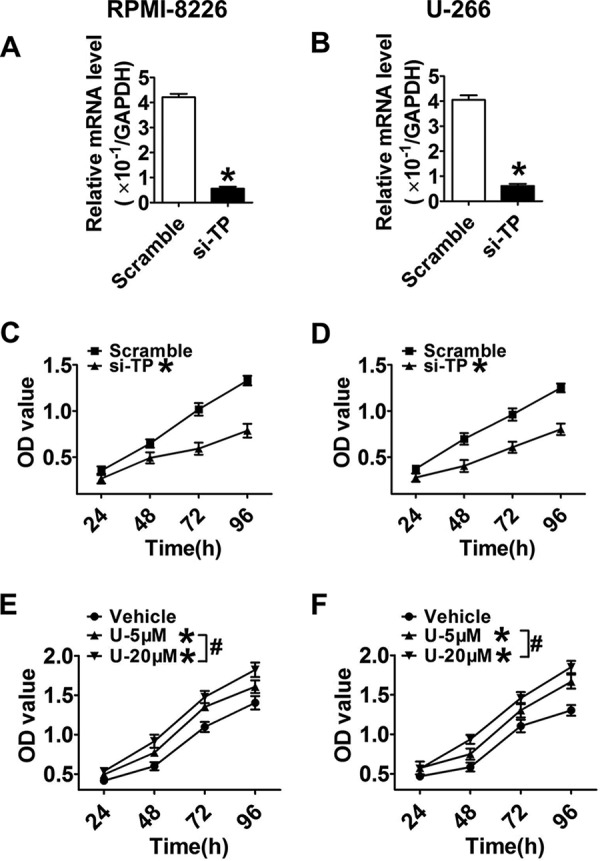
MM cell proliferation was suppressed by TP silencing or promoted by the TP agonist. A and B, TP knockdown efficiency in RPMI-8226 and U-266 cells was examined by qRT-PCR at 24 h post-transfection. Data are normalized to GAPDH levels. *, p < 0.05 versus scramble; n = 3. C and D, proliferation in MM cell lines transfected with TP siRNA or scrambled control at four time points was examined by CCK-8 cell proliferation assays. Red, scramble; black, TP siRNA. *, p < 0.05 versus scramble; n = 3. E and F, cells were supplemented with graded concentrations of the TP agonist, U46619, for 24, 48, 72, and 96 h, respectively. Red, vehicle; green, 5 μm agonist; black, 20 μm agonist. *, p < 0.05 versus vehicle; #, p < 0.05, differences among drug additional treatments with graded concentrations; n = 3. Error bars, S.E.