FIGURE 5.
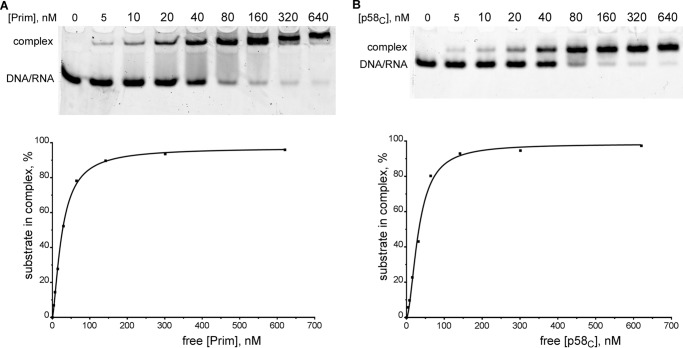
Primase and p58C bind the template-primer with a similar affinity. Primase (A) or p58C (B) of varying concentrations were incubated with T5-P1 (20 nm; T5 is labeled with Cy3 at the 5′-end). The reaction products were separated by 5% native PAGE with subsequent visualization using the Typhoon 9410 imager (emission of fluorescence at 580 nm). The graphic analyses of the obtained data were performed using the Prism 6 software (one-site specific binding with a Hill slope). Concentration of the free protein was calculated by subtracting the concentration of the protein-DNA/RNA complex from the total protein concentration.

